
 Minter
 Quack AI
 NEAR Protocol
 Sui
Sui Hyperliquid
 Cardano
 Raydium
- The XEC volume is showing a decline of 59% in the last 24 hours.
- XEC coin holds the #93 rank in the list of top global cryptos.
XEC, formerly known as Bitcoin Cash ABC (BCHA). Positioned as a “cryptocurrency intended for electronic cash usage,” eCash is designed exclusively for transactions involving the purchase of goods and services.
The rebranding took place on July 1, 2021, as the coin sought to establish its unique identity separate from its predecessor.
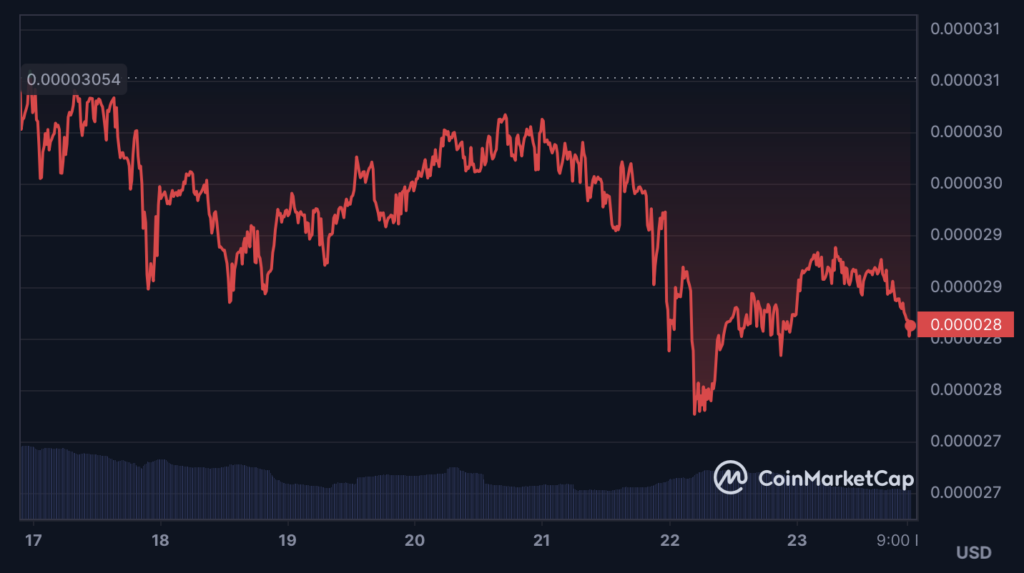
Financials of the XEC Coin
The XEC coin is currently valued at $0.00008, experiencing a 0.1.81% decline in today’s market session. It is moving within a negative pattern, exhibiting significant volatility.
The total trading volume of the coin is $4.78 Million, witnessing a decrease of over 59.2% in the last 24 hours, indicating the presence of sellers in the market. The coin holds an open interest of $2.89 Million.
With a maximum supply of 21 Trillion coins and a circulating supply of 19.5 Trillion, the coin maintains a market cap dominance of 0.037%. XEC is ranked as #93 among the top coins.
Price vs Volume Analysis of the XEC Coin
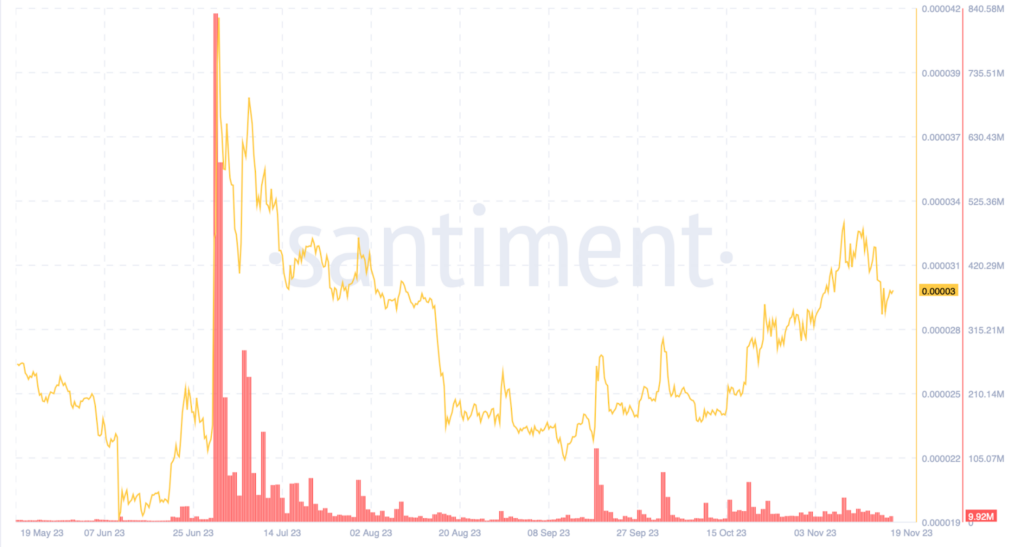
Observing the chart above, it becomes apparent that the XEC coin’s price is declining, accompanied by a decrease in volume, indicating the presence of sellers in the market. The overall price movement aligns with the sellers’ strategy and profit booking is easily visible.
eCash (XEC) Technical Analysis
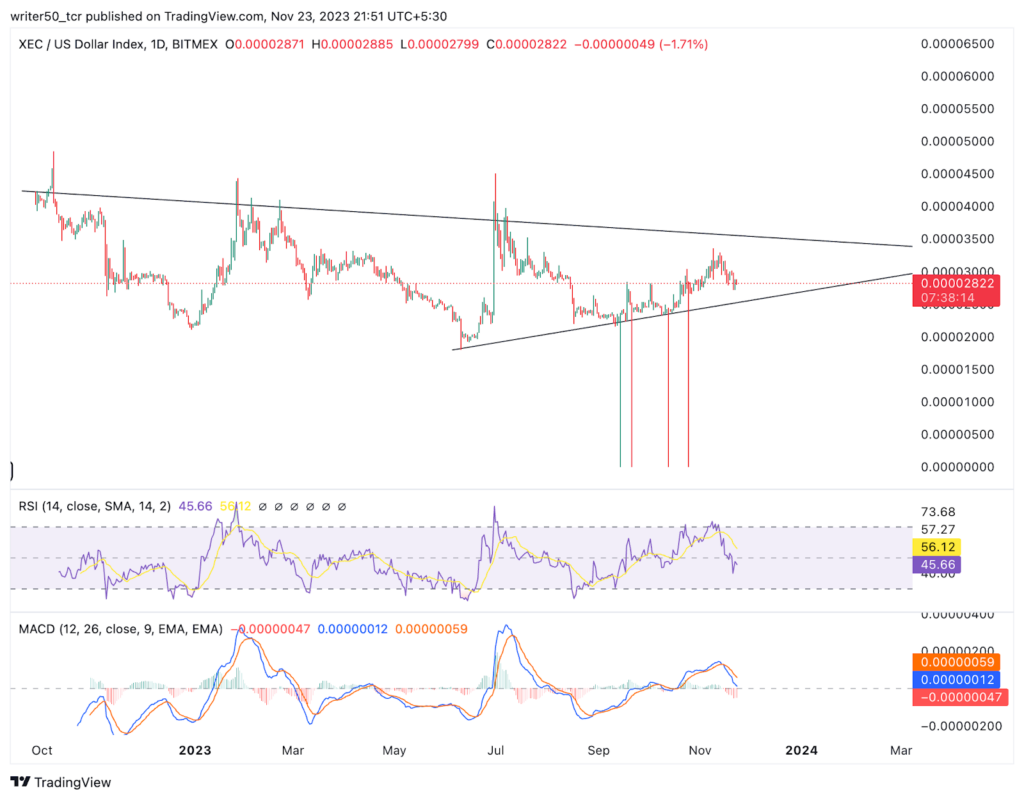
The coin witnessed a peak at $0.00005926 in November 2021, followed by a significant 95% decline. Finding support at the $0.000019 level, the price movement is currently confined within a descending triangle pattern.
Despite multiple attempts to breach the triangle, the price encountered wick rejection, leading to noticeable volatility. Overall indicators suggest a prevailing negative momentum. A potential break below the support line may signal a further decline in the coin price.
Technical Indicators Overview of XEC Coin
The present MACD line for the XEC coin is positioned beneath the signal line, signifying a negative pattern and pointing towards a potential decline in price.
Furthermore, the RSI line for XEC is currently trading below the SMA line. This arrangement is considered a negative pattern, increasing the likelihood of a decrease in price in the future.
Conclusion
The XEC coin is showing a diminishing trading volume. The overall structure is weak and the indicators are displaying a bearish signal. If the price moves below the support level, a further decline in price can be seen.
Technical Levels
- Support Levels: $0.000025 and $0.000019
- Resistance Levels: $0.000031 and $0.000040
Disclaimer
The views and opinions of the author, or anyone named in this article, are for informational purposes only. They do not offer financial, investment, or other advice. Investing or trading crypto assets involves the risk of financial loss.




