
 Altai the Tiger
 IGNITION
 streamoors
 NEAR Protocol
 Sui
Sui Ethereum
 Pudgy Penguins
- Harmony Coin price has faced rejection from the resistance level of $0.01613.
- The coin price has broken the falling wedge pattern on the daily chart.
- The current market price of the ONE coin is $0.01296.
In the initial stage of the trading, the coin price witnessed a great decline and the price has remained bearish for more than a year. In this decline, the coin price created an all-time low level of $0.001257 on March 13, 2020.
The coin price started an uptrend at the beginning of year 2021. It has shown a massive surge in the price, as the price has taken a massive jump of over 8000% within one year.
In this surge, the token price created an all-time high level of $0.3798 on October 26, 2021. The bulls have tried to cross this high in January 2022, but the coin price has reversed near from the previous high level of $0.3798.
From the higher level, the token price has shown a great decline and it has melted down over 96% of the gains. It is currently in a downtrend and the bulls are trying their best to change the bearish structure of the coin.
Can Harmony Coin Price Able to Reach the $0,05000 level?
The Harmony coin price has formed a falling wedge pattern on the daily chart and it has branched this pattern recently. After the breakout, the token price surged massively from the lower level.
The coin price has breached the crucial resistance level of $0.01120 in the recent surge and now this level will act as a support for the price. Apart from this, the other support for the price is present near the bottom level of $0.00860.
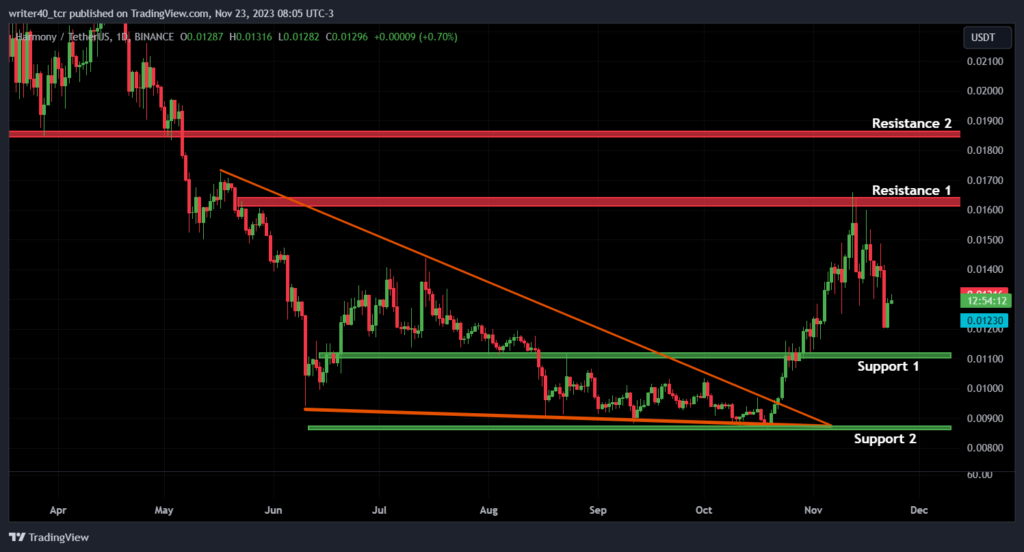
ONE coin’s price has faced a rejection from the resistance which is present near the $0.01612 level. It has declined by over 10% in a week and formed a bearish candle on the daily chart. If the price breaks the resistance level of $0.01612, it can move towards the level of $0.01844.
Are EMAs and RSI Bullish or Bearish on the ONE Coin?
The Harmony token price is trading above the 50-day exponential moving average (EMA) but below the 200-day EMA. It signifies that the bulls are getting stronger but they need to beat the sellers present near the 200-day EMA.
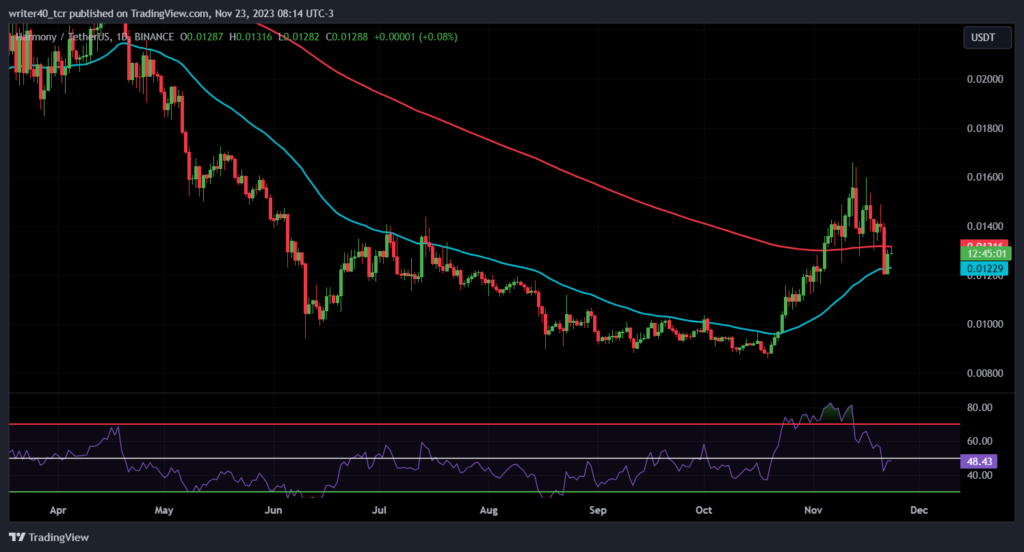
The relative strength index is curving at 48.43, which signifies that the bears are in momentum. Additionally, the slope of the RSI Is bending downwards which confirms that the bulls have lost momentum which is shifting towards the bears.
Conclusion
The ONE coin price has shown a great surge in recent times. However, it has faced rejection from the resistance level of $0.01612 and the indicators are also turning bearish.
Technical Level
Resistance Level – $0.01612 and $0.01844
Support Level – $0.01120 and $0.00860
Disclaimer
The views and opinions stated by the author, or any people named in this article, are for informational purposes only. They do not establish financial, investment, or other advice. Investing in or trading crypto assets comes with a risk of financial loss.




