
 Quack AI
 Pudgy Penguins
 Starknet
 Pearl
Pearl Sui
Sui Celestia
 Quantus
- The HT coin is trading below the 200-day EMA, which suggests a long-term bearishness in the market.
- The HT price declined by 6.02% over the past seven days.
Current Price – $2.8202 (+1.14%) Sentiment – Bearish
Max Supply – 500.0 Million Fear & Greed Index – 68 (Greed)
Volatility – 9.70% (High) Green Days – 17/30 (57%)
RSI – 52 (Neutral) 200–Day EMA – $2.8634(Sell)
Trading Volume (24h) -$43.1 Million All-time high – $39.81
Based on recent data, Huobi Token holds a market capitalization of $555.8 Million, while the circulating supply is 162.2 Million HT.
What is Huobi Token?
The Huobi Token (HT) is a decentralized digital asset based on the Ethereum blockchain and the native token of the cryptocurrency exchange Huobi Global. The Huobi exchange uses HT tokens for its loyalty program that rewards members and the company uses these tokens to confer voting rights on users of the Huobi Autonomous Digital Asset Exchange (HADAX).
Huobi Token HT Price Prediction For 2024, 2025, 2026, 2027, 2028, 2029, and 2030
| Year | Year Low | Year High |
| 2024 | $2.35 | $3.22 |
| 2025 | $3.09 | $11.25 |
| 2026 | $2.73 | $4.38 |
| 2027 | $2.25 | $3.25 |
| 2028 | $1.4998 | $3.25 |
| 2029 | $3.11 | $19.65 |
| 2030 | $2.25 | $5.61 |
All the prediction data is based on the price performance algorithm of the Huobi Token.
HT Price Prediction 2025
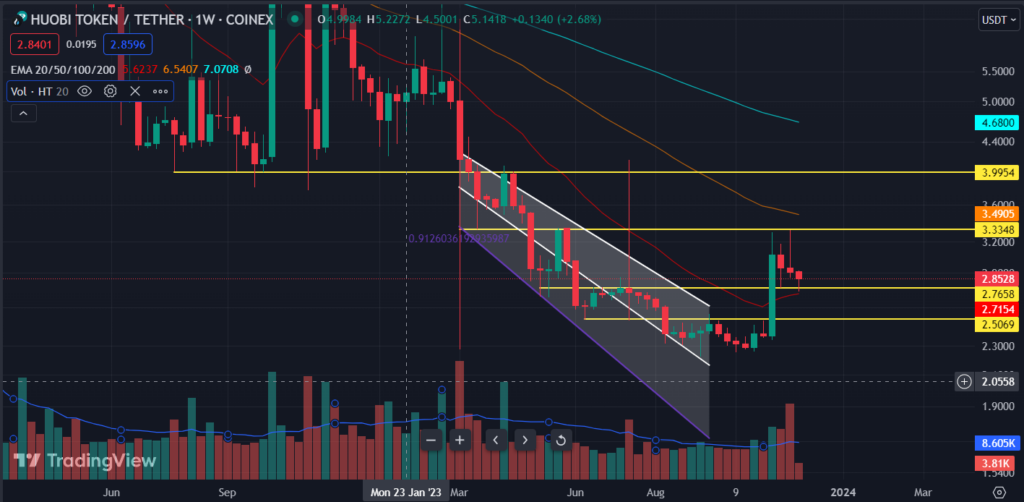
Over the weekly timeframe chart, Huobi’s price experienced a breakout in the downtrend and it is facing toward the upper levels. The selling pressure has been rising since the past few weeks and trading volume is falling, suggesting the price could fall for a short duration.
Based on our HT price analysis, the price of Huobi Token could increase by 294% and reach $ 11.25 if bullishness continues in the market. On the other hand, the minimum price value HT could hit by 2025 is $2.09. These predictions can be changed as per the HT’s future price action.
HT Price Prediction 2030
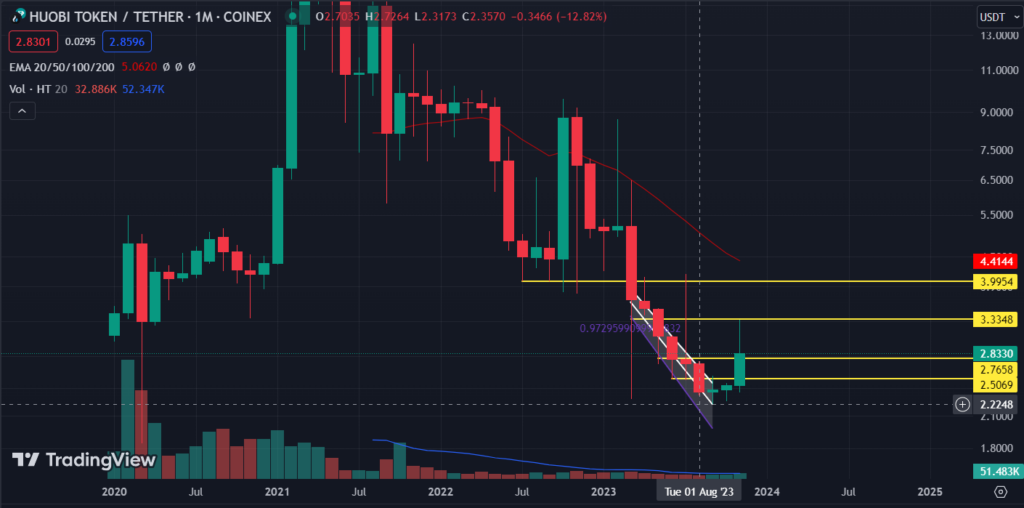
The HT token price has been forming bullish candlesticks for the past three months, highlighting a positive outlook over the chart. However, the trading volume is low and buyers need to trade with a high volume.
As per the price algorithm and previous price data, the HT price could gain 97% and reach up to $5.61 by 2030. The minimum price HT could gain by 2030 is $2.25.
Technical Outlook of the HT Coin Over Daily Timeframe
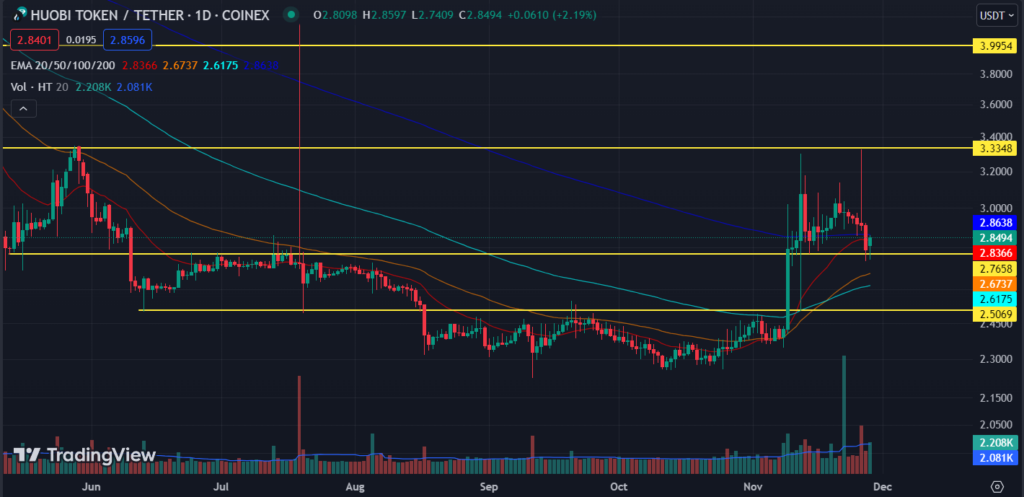
The Huobi token price is currently trading above 20, 50, and 100-day exponential moving averages, indicating that buyers are attempting to push for an upward move. However, HT is still trading below the 200-day EMA, which suggests a long-term bearish dominance in the market.
In October, bullishness started to rise after a long-term downtrend. However, buyers lost their confidence, and the prices began to consolidate within a range. At the moment, buyers are getting rejected at $3.3348 and sellers are actively pushing the price towards the recent support level.
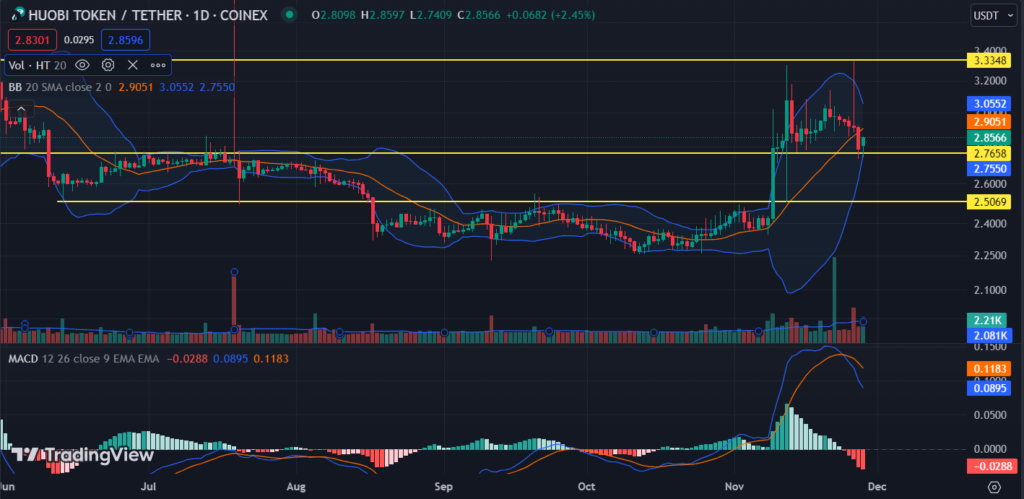
If buyers manage to sustain the price above the $2.7 level, we might see a breakout above resistance. However, if there’s a breakdown below the recent support, it could lead to a fall in prices.
The HT coin registered an intraday trading volume of $43.1 million. That is an increase of approximately 25% since the previous session, reflecting that buyers are exerting upward pressure in the market.
The HT price is trading at $2.8287, with an intraday gain of 1.39%. However, the HT price declined by 6.02% over the past seven days, highlighting bearish dominance in the market.
Testimony of Technical Indicators
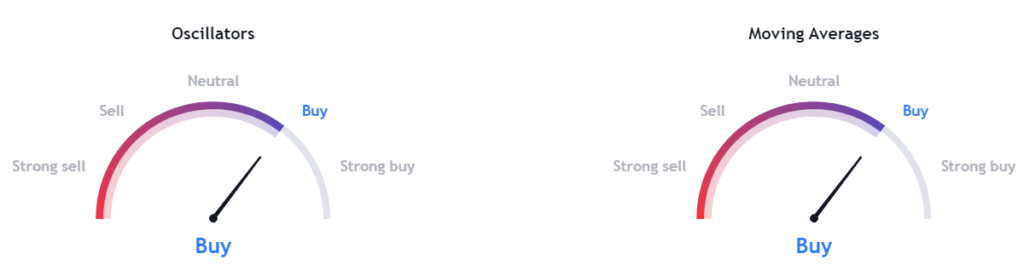
| Indicator( Occilators/Moving Averages) | Value | Prediction |
| Relative Strength Index | 55 | Neutral |
| Chaikin Money Flow | 0.05 | Buy |
| Average Directional Index | 55.44 | Neutral |
| MACD (12, 26) | 0.0895 | Sell |
| Bull Bear Power | -0.1608 | Buy |
| Stochastic %K (14, 3, 3) | 18.63 | Neutral |
| 20-Day EMA | 2.8372 | Buy |
| 50-Day EMA | 2.6739 | Buy |
| 100-Day EMA | 2.6176 | Buy |
| 200-Day EMA | 2.8634 | Sell |
| Volume Weighted Moving Average (20) | 2.9116 | Sell |
HT Price Prediction Tomorrow and Next Week
| Date | Price | Change |
| November 29 | $2.81 | 0.00% |
| November 30 | $2.88 | 2.32% |
| December 01 | $2.96 | 5.21% |
| December 02 | $3.02 | 7.34% |
| December 03 | $3.01 | 7.18% |
| December 04 | $3.04 | 8.01% |
| December 05 | $3.04 | 7.97% |
The predicted price data is based on the monthly and weekly performance of Huobi Token.

Huobi Token Price Prediction FAQs
What is HT coin’s Price Today?
Based on the HT prediction chart, the price of the HT coin increased by 1.39% and reached $2.8272 by November 28, 2023.
What is the all-time high of the HT Token?
HT token has an all-time high price of $39.81, the current price is 92.99% below the record-high price.
What is the Intraday Trading Volume of HT?
The Huobi crypto has an intraday trading volume of $43.1 Million with an increase of 25% in Tuesday’s session.
Will HT Reach $100?
Huobi Token would need to gain 3,408.46% to reach $100 which is close to impossible in the upcoming session. As per the prediction, the highest expected estimated price is $ 19.65.
Will HT Reach $1000?
Huobi Token would need to gain 34,984.62% to reach $1,000 and the highest expected price is 19.65 which is achievable by 2029.
Is HT Token a Profitable Investment?
The current market sentiments are bearish and investing in HT at this time is not suggested. The year-to-date performance of Huobi is -45.32%, reflecting a negative outlook for long-term investors.
Conclusion
As per technical analysis, the current forecast for Huobi Token in 2023 is bearish. The HT coin price is trading within a range with a low trading volume. If buying volume rises in the upcoming session, an upward move might be witnessed. As of now, bears are dominating and prices could fall in the future sessions.
Technical Levels
| Levels | Value(USD) |
| Support 2 | $2.5069 |
| Support 1 | $2.7658 |
| Price | $2.8446 |
| Resistance 1 | $3.3348 |
| Resistance 2 | $3.9954 |
Disclaimer
Investing in stocks and other Initial Coin Offerings (“ICOs”) is especially volatile and speculative, and this article does not advise investing in cryptocurrencies, stocks, or other ICOs. Since everyone has their uniqueness, a certified professional should be continually consulted before making any economic decisions.




