
 Walrus
 Quantus
 Pudgy Penguins
 Bitway
 Quant
Quant Sui
Sui Bitcoin
- The OKB crypto is forming bearish patterns at the higher levels.
- The OKB crypto price has lost its value by 2.4% in the last 24 hours.
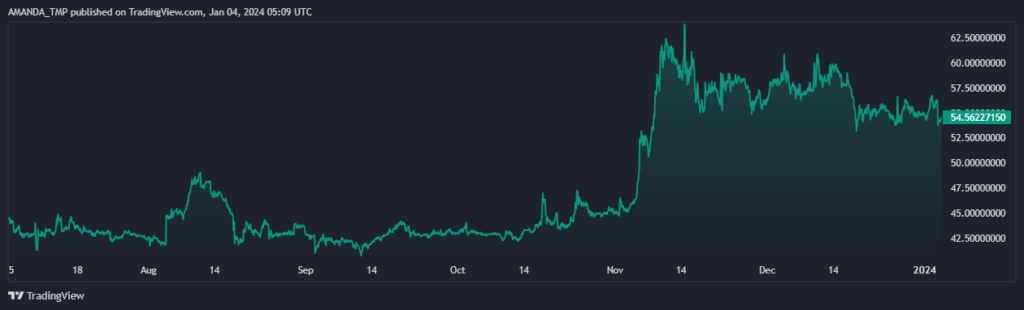
OKB is the utility token of OKX, a global crypto exchange platform. OKB holders can enjoy discounts, passive income, and exclusive access on OKX. OKB was created by Mingxing Xu and Jay Hao. OKB has a buy-back and burn program to reduce its supply and increase its value.
The OKB crypto has witnessed a huge surge of 86.9% in its trading volume in the last 24 hours. This has resulted in a traded volume of $13.023 Million, which indicates activity in the crypto community.
The market cap of the OKB crypto has declined by 2.5% and the current market cap value of the crypto is $3.255 Billion. The market cap ranking of OKB is 28th in the global cryptocurrency market.
OKB is trading in the market with a volume/market cap ratio of 0.26% and the market cap dominance of the crypto is 0.189%. Additionally, the fully diluted market cap of the OKB crypto is $16.345 Billion, and it has a circulating supply of 60.0 Million OKB.
OKB Crypto Token Overview
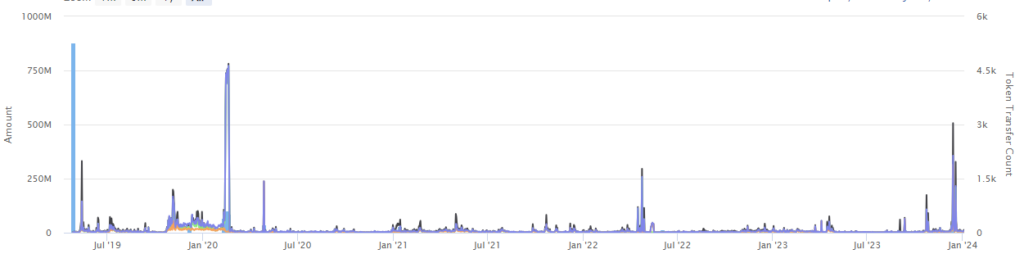
The OKB crypto currently has 51.52K holders and the number of total transfers recorded is 145,562. Moreover, the crypto has a max total supply of 300.0 Million.
OKB Crypto Technical Analysis
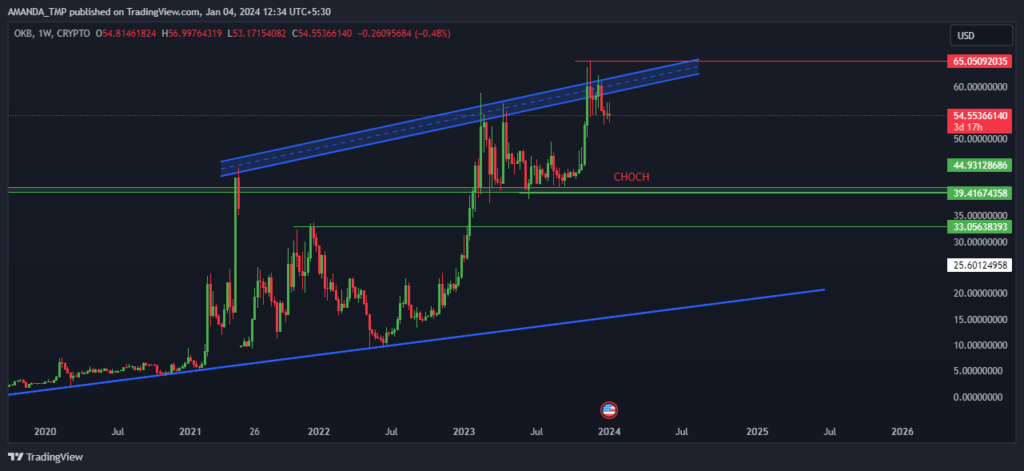
After rising to certain highs, the OKB crypto is witnessing selling pressure from a dynamic trendline. This has resulted in the formation of a lower low structure on the charts while the major trend of the crypto is still bullish.
The next major support for the OKB token is at $38.30 and if it sustains above this level and forms a bullish candlestick pattern, we might get to see a continuation in the trend of the crypto toward higher levels.
OKB/USD Chart by TradingView
On the daily chart, the indicators are giving a buy signal as the EMAs such as the 20-day and the 50-day EMAs are forming a golden cross. Despite this, the price of the OKB crypto has declined below the 50-day EMA.
The RSI is also situated below the 50-level, declining below the 14-day SMA. Currently, the RSI is at a level of 43.45 and if it breaks below the level of 30, the change in trend to bearish can be witnessed for the short term.
Conclusion
The price of OKB is facing strong resistance and forming lower lows. The technical indicators are showing signs of weakness and decline. OKB could drop further if it breaks below the support level of $38.30.
Technical Levels
Support Levels: $39.00 and $44.500
Resistance levels: $65.05 and $80.00
Disclaimer
This article is for informational purposes only and does not provide any financial, investment, or other advice. The author or any people mentioned in this article are not responsible for any financial loss that may occur from investing in or trading. Please do your research before making any financial decisions.




