
 Dacity Coin
 streamoors
 Pudgy Penguins
 Injective
 Celestia
 Sui
Sui Pearl
Pearl
- A wallet withdrew 650,528 RNDR worth $2.59M from Binance on January 9.
- The price of the Render crypto is following a strong uptrend.
As per an Onchain thread on X, an Anchorage Digital wallet deposited 250K RNDR to Binance, which is worth $2.72M.
It shows strong activity in the Render crypto, and more details can be seen on the thread by @lookonchain.
An #AnchorageDigital related wallet deposited 250K $RNDR($2.72M) to #Binance for profit in the past 12 hours.
— Lookonchain (@lookonchain) May 16, 2024
This wallet withdrew 650,528 $RNDR($2.59M) from #Binance at $3.98 on Jan 9.
There is currently 400,528 $RNDR($4.26M) left, a profit of $4.4M, and an ROI of 170%.… pic.twitter.com/oX5ry2d9ya
The Render crypto is experiencing bullish sentiment. The fear and greed index is at 70, which indicates greed among investors. Despite this, the price volatility of the crypto is high, resulting in 13.41%.
The value of the traded volume for the Render crypto has advanced by 18.4% over the last 24 hours from press time. It has resulted in a traded value of $700.31M, which shows a larger engagement of traders in crypto.
The market cap of Render has also been rising and has advanced by 5.3% in the last 24 hours. Also, Render has a very good market presence, as it has a market cap dominance of 0.17% in the global cryptocurrency market.
Render has a very good amount of liquidity, as 16.8% of the crypto’s market cap has been traded in the last 24 hours.
There are 388.643M RNDR cryptos in circulation, which is 72.39% of the maximum supply of the crypto. Moreover, the total supply of the crypto is 532.07M RNDR, and the fully diluted market cap of the crypto is $5.755B.
The Render crypto price has advanced by 28985% from its all-time low. Additionally, the all-time low price of crypto was recorded four years ago, on June 16, 2020. This shows that in just four years, crypto has made huge returns to its investors.
Why are Derivatives Opposing the Technical Trend Of Render?
Over the last 24 hours, the Render crypto has witnessed higher long liquidations worth $431.74K, against which the short liquidation values are $294.78K. This shows higher profit booking from longs in the crypto.
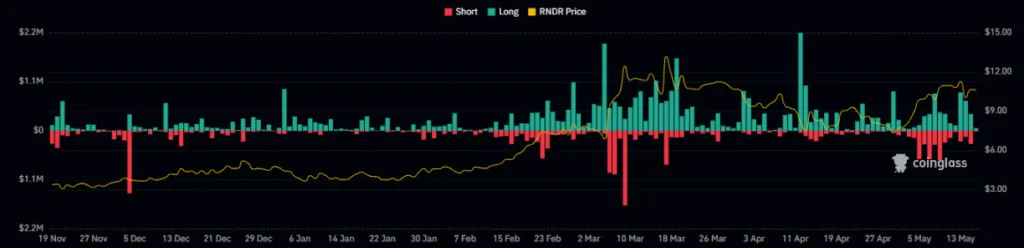
The derivatives trading volume for the crypto has also advanced by 11.6% over the last 24 hours following the open interest, which has also witnessed an advance of 7.87%.
The following surge in the open interest shows that traders have made more positions in the crypto derivatives.
RNDR Crypto Technical Chart Overview
The price of the RNDR crypto was trading inside a descending triangle pattern, and it further broke above the following pattern and is advancing to higher levels.
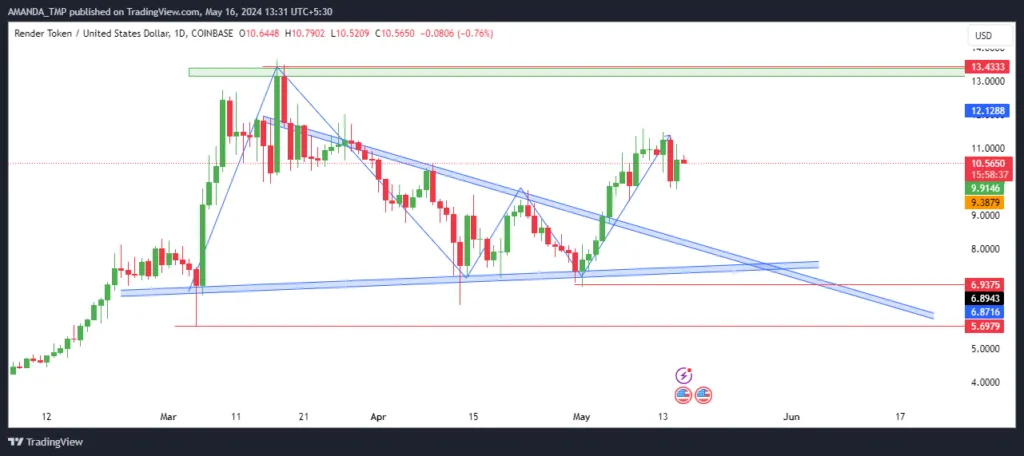
Since the breakout in the trading price, the RNDR crypto price has been consistently advancing. That shows strong buying sentiment in the price.
The crypto price has advanced by 25%, and there is still much space left on the higher side for the crypto price to advance.
Moreover, the resistance level of the crypto is at $13.5. If the price breaks above this resistance level, it might face resistance at the level of $15.0.
RNDR/USD Chart by TradingView
Crucial EMAs like the 50-day and the 200-day periods are trading in a golden cross witnessing a strong uptrend in the crypto price. The price of the RNDR crypto is also sustaining above the EMAs and is currently taking support at the 20-day EMA.
The Bollinger band on the daily chart of the RNDR crypto has also expanded which shows the expansion in the momentum of the crypto price. This also shows that big moves in the crypto might come soon.
MACD also gives a strong buy signal, and its metrics trade in a bullish zone followed by a bullish crossover.
The RSI is also sustaining above the 50-level and is currently trading at a level of 57.6. It gives a bullish outlook on the momentum of the crypto price.
Summary
The RNDR crypto is experiencing a surge in activity, with significant transactions indicating bullish sentiment.
Market indicators, including high trading volumes and a rising market cap, support this trend. Technical analysis suggests continued upward momentum, with solid support from key indicators like EMAs, MACD, and RSI, signaling a bullish outlook.
Moreover, if the price of the RNDR crypto fails to sustain the higher levels, it might take support at the lower levels of $5.70 and $6.940.
Disclaimer
This article is for informational purposes only and does not provide any financial, investment, or other advice. The author or any people mentioned in this article are not responsible for any financial loss that may occur from investing in or trading. Please do your research before making any financial decisions.




