
 Dacity Coin
 Pearl
Pearl Injective
 Pudgy Penguins
 Pump.fun
 Quant
Quant Quantus
- The price volatility of the Chainlink crypto is very high at 9.61%.
- LINK crypto’s price has outperformed 67% of the top 100 crypto assets in the last 1 year.
Chainlink, created by Sergey Nazarov and Steve Ellis in 2017, is a decentralized oracle network connecting real-world data to Ethereum smart contracts.
The LINK token pays for Oracle services, incentivizing data accuracy. Chainlink enables secure, reliable dApps across finance, supply chain management, and other decentralized applications.
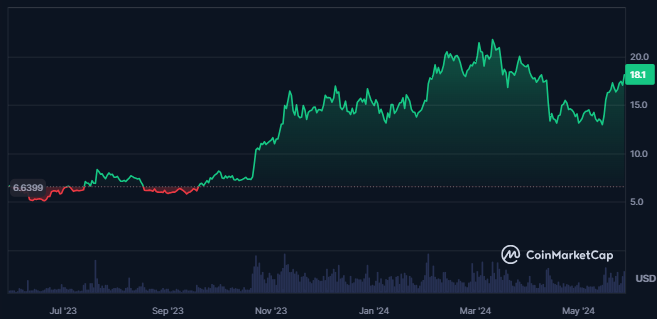
Over the last year, the trading price of Chainlink crypto has advanced by 177% and is currently trading at a level of $18.09. Moreover, the market cap value of the crypto is $10.617B.
Chainlink is the 13th largest cryptocurrency in the global crypto market. It has a market cap dominance of 0.41% in the global crypto market.
The Total Value Locked for crypto is nil, and 7.44% of the market cap of the crypto is staked in the crypto market. Also, the liquidity of Chainlink crypto is worth $82.41M.
What Do Derivatives Say About the Chainlink Crypto Price?
A huge increase in the trading volume and derivatives trading volume of Chainlink has been witnessed in the last 24 hours.

Following the advance in the trading volume of the crypto, the open interest has also advanced by 9.7%, resulting in $262.21M. It further shows a rise in the open positions of crypto derivatives.
Additionally, the recorded short liquidation for Chainlink over the last 24 hours is double the long liquidations of the crypto. This shows the bulls’ dominance in the price of the crypto.
LINK Crypto Technical Analysis
After consolidation in a tight range for more than 500 days, the crypto price broke above the consolidation range on 16th October 2023.
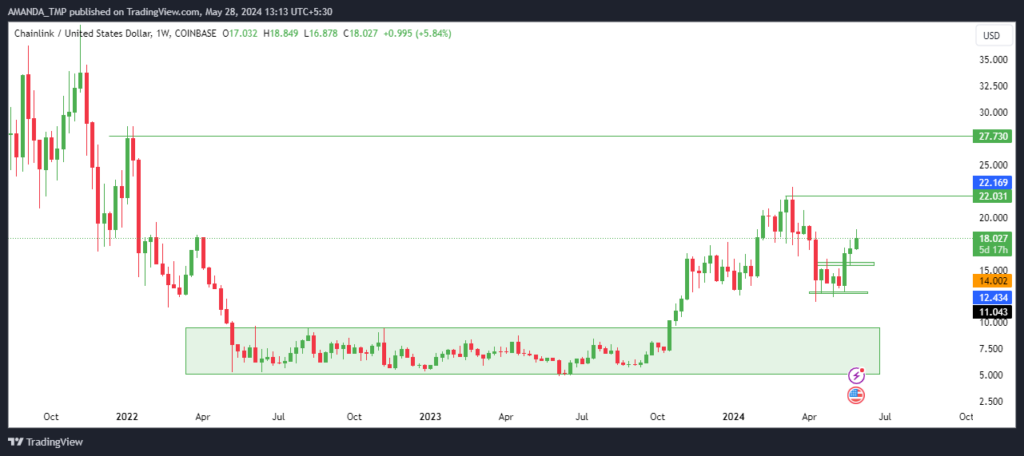
After the breakout, the LINK price advanced to higher levels, leading to a rise of 120%.
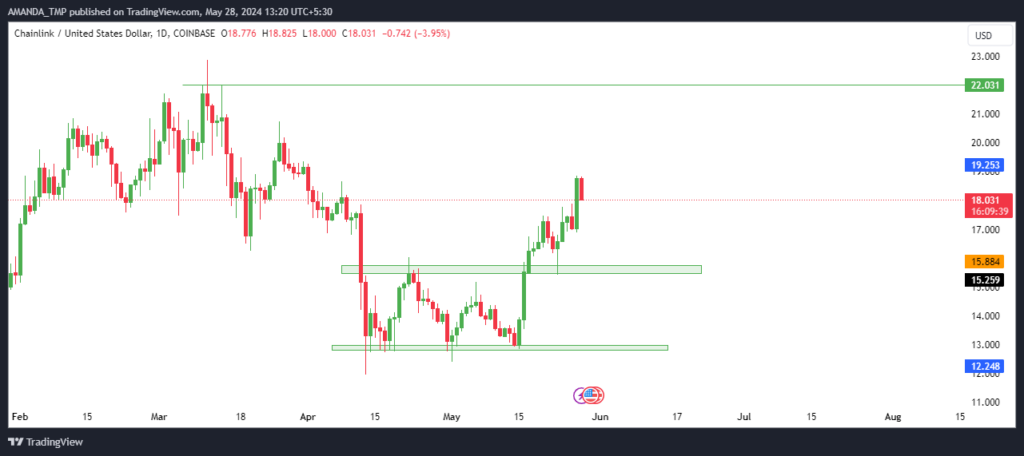
We can see a strong breakout in the crypto structure by lowering the timeframe to daily. The momentum of the price also looks strong, followed by strong bullish candles on the chart.
LINK/USD Chart by TradingView
The crypto’s price has declined below the crucial plotted EMAs on the chart a few days ago. Despite this, the 50-day and the 200-day EMAs are trading in a golden crossover, leading to a spike in the crypto price.
The MACD also gave a strong buy signal on the daily crypto chart. This is followed by a bullish cross of MACD, and the signal line is followed by bullish histograms on the chart.
The RSI has also hit the overbought levels, advancing above the 14-day SMA, which shows strength in the crypto trading price.
Summary
Chainlink has shown strong bullish momentum, with its price advancing by 177% over the last year to $18.09.
The recent breakout from a 500-day consolidation range and bullish technical indicators, including a golden cross and strong MACD and RSI signals, suggest further increases in the price.
On the higher side, the resistance level for the LINK crypto is at $22.0 and $27.0, while the support levels of the crypto are $12.8 and $15.5.
Disclaimer
This article is for informational purposes only and does not provide any financial, investment, or other advice. The author or any people mentioned in this article are not responsible for any financial loss that may occur from investing in or trading. Please do your research before making any financial decisions.




