
 streamoors
 IGNITION
 NEAR Protocol
 Injective
 LayerZero
 Pearl
Pearl Hyperliquid
- The trading price of the BTC coin is down by 1.1% over the last 1 week.
- Bitcoin has 93.83% of its total supply circulating in the global crypto market.
Bitcoin (BTC) is the first successful decentralized cryptocurrency created by Satoshi Nakamoto. It uses blockchain technology for secure, pseudonymous transactions.
Bitcoin’s supply is capped at 21 million coins, with new blocks mined every 10 minutes. BTC is used for payments, as a store of value, and as an investment.
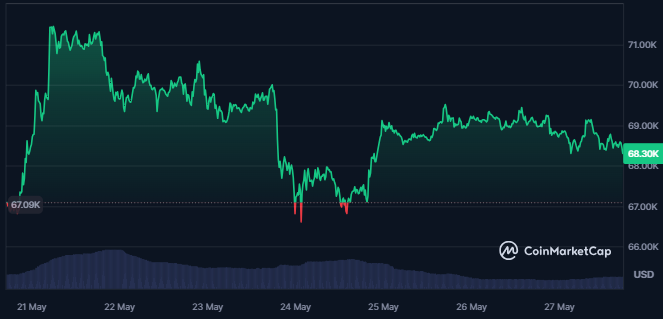
The May month closing is approaching. If the price of the BTC sustains the higher levels, we might see a bullish candle on a monthly timeframe.
The market cap of Bitcoin has advanced to $1.347T, and the price of the crypto has started to take rejections from the higher levels. That is making it hard for the crypto to achieve its all-time highs.
How Did the Bitcoin Price Perform During the Previous Week?
The level of $69,000 has become crucial for traders, who are waiting for the price to break above the mentioned level and sustain above the same.
Over the past week, there has been significant activity in the Bitcoin ETF market, followed by an inflow of 15,000 BTC into Bitcoin ETF, marking a milestone in the crypto space.
The liquidation in the BTC crypto further is witnessing a strong fight between the buyers and the sellers, followed by the same amount of liquidations in both directions in the crypto price.
What Do the Technicals of Bitcoin Indicate for the Upcoming Week?
The BTC crypto price is trading inside a falling wedge pattern. It has currently advanced to a higher level of the pattern.
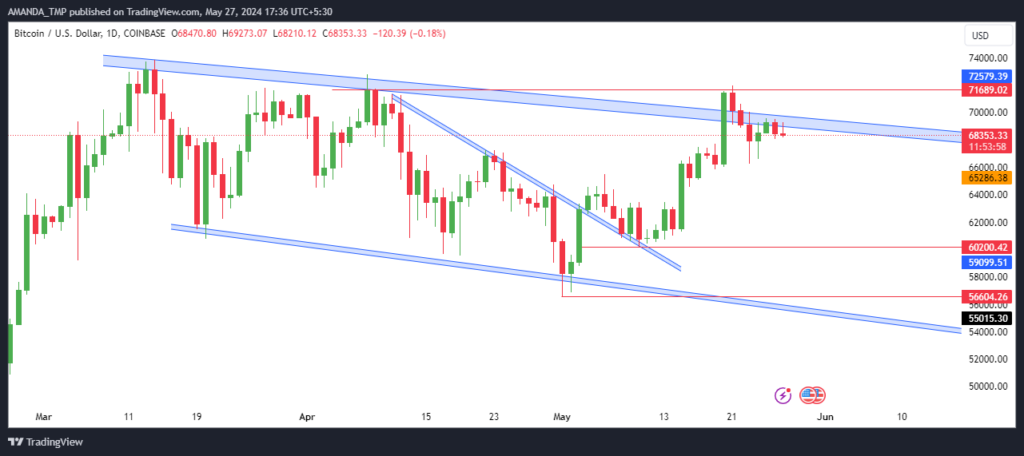
Bitcoin’s price is currently experiencing rejection from higher levels. However, if we look at the length of the candlesticks, the bearish candles formed on the chart are very small compared to the bullish candlesticks.
That price behavior shows that the bulls are still in power. The price might break above the recent swing highs and continue to advance to new highs.
BTC/USD Chart by TradingView
The EMAs on the daily chart of the BTC crypto indicate a strong uptrend, as the deviation between the 50-day and the 200-day EMAs is very high. The EMAs are trading in a golden crossover.
The MACD is strongly bullish on the chart as the MACD and the signal line are trading in a bullish crossover and have sustained above the bullish trajectory.
The RSI on the charts is also bullish as the indicator’s value has sustained above the 50-level for a long time and is following a bullish cycle.
Summary
Bitcoin’s price is down 1.1% this week, but technical indicators show bullish momentum.
Trading inside a falling wedge pattern, the BTC price is poised for a potential breakout when trading inside a falling wedge pattern. The MACD, RSI, and EMAs indicate bullish trends, suggesting that Bitcoin may advance to new highs if it sustains above key levels.
The support levels for Bitcoin crypto are $56,600 and $60,200. Also, the resistance levels on the higher side are at $72,000 and $73,950.
Disclaimer
This article is for informational purposes only and does not provide any financial, investment, or other advice. The author or any people mentioned in this article are not responsible for any financial loss that may occur from investing in or trading. Please do your research before making any financial decisions.




