
 Pearl
Pearl Bitway
 Zcash
Zcash Walrus
 Aerodrome Finance
 Starknet
 NEAR Protocol
- The trading price of the RNDR crypto has advanced by 298% in the last 1 year.
- Render crypto has traded in green for 19 days in the last 30 days.
Render leverages blockchain to provide decentralized GPU-based rendering solutions using its native cryptocurrency, the Render Token (RNDR). Founded by Jules Urbach in 2016, Render democratizes access to rendering resources.
RNDR tokens facilitate exchanges between creators needing rendering and node operators providing GPU power, supporting the digital content creation process.
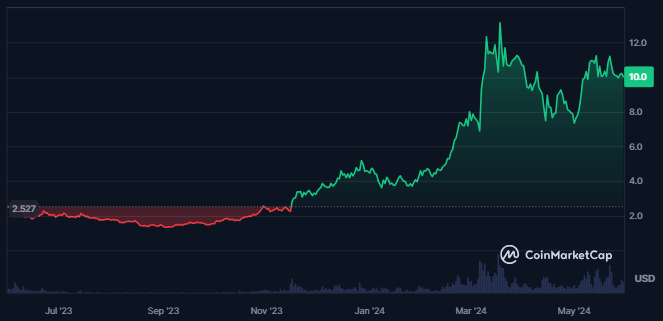
When writing, the traded volume for the Render token declined by 9.4% in the last 24 hours. Also, the value of the traded volume is $312.035M, which is 8.64% of the crypto market cap.
The total supply of the crypto is 532.07M RNDR, and the circulating supply of the crypto is 388.643M RNDR. Also, the fully diluted market cap of the crypto is $5.425B, and the market cap value of the crypto is $3.928B.
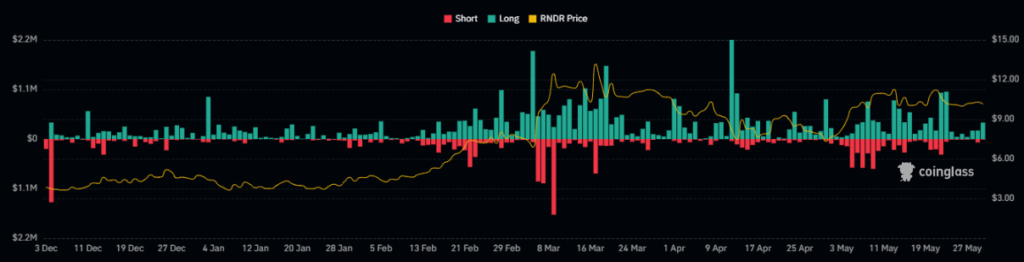
Why Does Derivatives Data of Render Support Bears?
The open interest for the Render token has declined by 4.25% in the last 24 hours, resulting in $194.76M.
The value of the traded volume for the Render token declined by 9.4% in the last 24 hours from press time. Also, the value of the traded volume is $312.035M, which is 8.64% of the crypto’s market cap.
The total supply of the crypto is 532.07M RNDR, and the circulating supply of the crypto is 388.643M RNDR. Also, the fully diluted market cap of the crypto is $5.425B, and the market cap value of the crypto is $3.928B.
RNDR Crypto Technical Analysis
The RNDR crypto price is trading inside a small consolidation zone where the crypto price has been revolving for the last month.
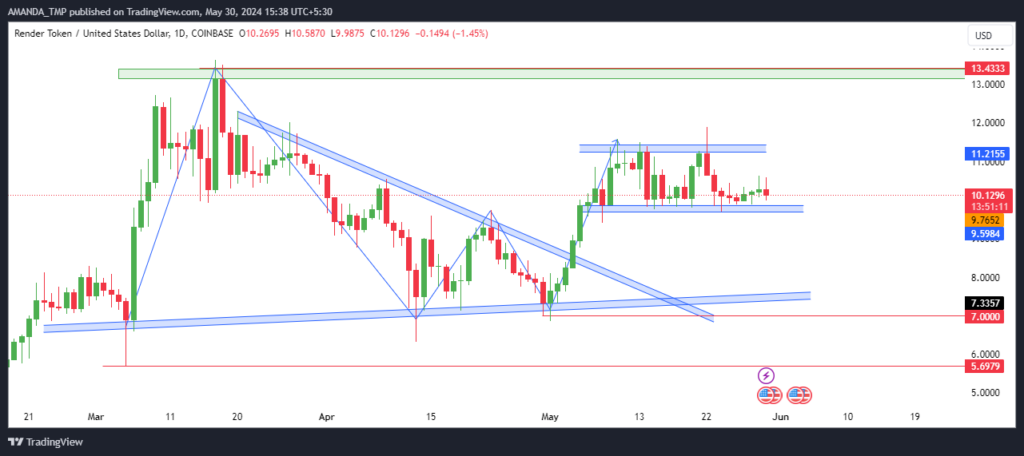
The price of the RNDR token traded inside a falling wedge pattern and broke out above the same on May 4, 2024, with strong volumes. This breakout led to an advance of 35% in the trading price of the crypto.
After the surge to the $11.5 level, the price started to lose momentum and began to revolve around by forming a small consolidation zone.
Due to a prior surge in the trading price of crypto, the technicals support an uptrend, but a breakout in the trading price of crypto can result in a better confirmation of a further trend in crypto prices.
Summary
The RNDR crypto surged 298% last year. It has been trading in green for 19 of the previous 30 days.
Despite a recent volume decline, the token’s price shows potential in a consolidation zone. Derivatives data indicates bearish trends, with higher long liquidations and uncertain future price movement.
The support levels for the RNDR crypto are $5.60 and $7.0, followed by the resistance levels of $13.5 and $15.0.
Disclaimer
This article is for informational purposes only and does not provide any financial, investment, or other advice. The author or any people mentioned in this article are not responsible for any financial loss that may occur from investing in or trading. Please do your research before making any financial decisions.




