
 Bitcoin
 Starknet
 Pearl
Pearl ZKsync
 NEAR Protocol
 Quantus
 Zerebro
- Injective price has been struggling below the 200-day EAM for the past 2 months.
- INJ has formed a descending triangle and is at the crucial level of breakout.
The INJ chart structure displayed a strong bullish momentum throughout 2023 with an enormous gain of 3800%. In the last month of 2023, the Injective price faced resistance from the $45 mark.
After multiple retests, the crypto price triggered a breakout from the major resistance level of $45 in mid-March and recorded a new all-time high. However, the breakout didn’t succeed and the price slipped below the $45 mark.
This fake breakout turned into a liquidity grab and most of the buyers were trapped at high. After stop losses were triggered, INJ price witnessed strong selling pressure. The price has dropped by 48.20% from its ATH.
MACD has formed green histograms even in the consolidation phase and the Signal line has exceeded the Zero line. RSI is at 60 and has generated a golden crossover with an RSI-based moving average.
INJ Price has Formed a Descending Triangle Pattern
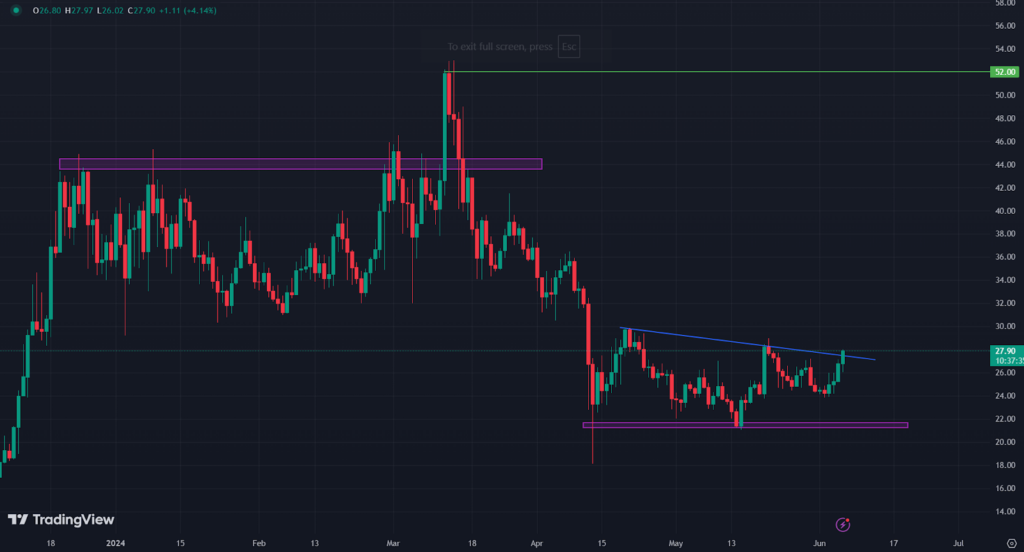
At press time, the Injective crypto price was trading at $27.73, up by 3.51% in the last 24 hours. The market capitalization is $2.57 Billion and the 24-hour trading volume is $90.54 Million.
Based on the chart, the INJ price has faced resistance from the 200-day EMA twice in less than 2 months. Currently, the price has reached the 200-day exponential moving average, and a breakout is awaited.
Breakout from the $200-day EMA may attract buyers which can help gain bullish momentum. The rise in trading volume at the time of the breakout may lead to strong buying momentum and the price may reach a new all-time high.
On the contrary, if the digital asset price faces resistance from the 200-day EMA, then it may melt to the support level of $20. If the INJ price starts trading below the $20 mark, then, selling pressure on a larger scale can be expected.
New All-time High Soon after Pullback?
$INJ
— ionicXBT (@theionicXBT) June 5, 2024
Simple chart.
Flip resistance and we go higher. pic.twitter.com/8SqqjXKrx2
The source on X says that the price has triggered a pullback on the weekly time frame. The overall trend is bullish and has taken support at the $20 level after a short-term bearish move. Buying momentum over the $26.74 level can be expected and may extend to an all-time high.
Conclusion
On a wider time frame, the INJ price is bullish while the sellers are dominating in the short term. The price has triggered a pullback on a weekly time frame and is expected to record a new all-time high. On a daily time frame, the Injective crypto price has been struggling below the key moving averages which showcases the bears’ grip. Most of the technical indicators are suggesting bullishness. After a fake breakout, the price has performed negatively but it has formed a base over the $20 hurdle. It is at the crucial level of breakout from the descending triangle pattern.
According to the chart, the Injective crypto can be interrupted at the $31.00 and $45 marks if it gains bullish momentum. On the other hand, if the sellers dominate then the INJ crypto price may take support on the $23.00 and $18.00 levels.
Disclaimer
This article is for informational purposes only and provides no financial, investment, or other advice. The author or any people mentioned in this article are not responsible for any financial loss that may occur from investing in or trading. Please do your research before making any financial decisions.




