
 Dacity Coin
 Quantus
 Pudgy Penguins
 Pearl
Pearl Injective
 Starknet
 NEAR Protocol
- The price volatility of Bitcoin is medium at 2.71%.
- The sentiment of the BTC crypto is bearish, as per Coincodex.
Bitcoin is the first decentralized cryptocurrency, utilizing blockchain technology for secure, censorship–resistant transactions.
Created by Satoshi Nakamoto in 2008, Bitcoin‘s supply is limited to 21 million coins. It operates on a peer-to-peer network, verified by miners, and is valued for its security, decentralization, and limited supply.
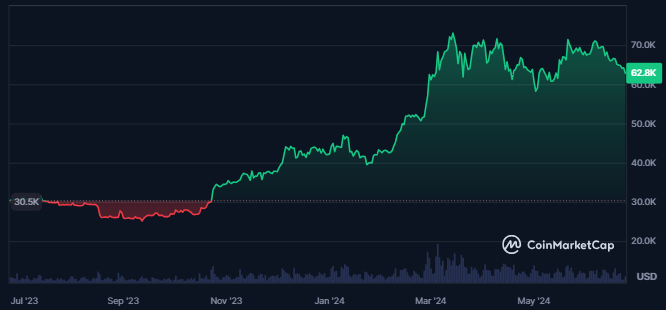
The trading volume of crypto derivatives has witnessed a surge of 135% in just the last 24 hours, resulting in a traded value of $19.338 Billion. This further results in a liquidity of 1.148%.
Despite the surge in the trading volume, the market cap has declined by 2.5% in the last 24 hours. This shows the rise in the declining momentum of crypto, followed by the sellers joining the decline.
The supply inflation of the crypto is also very low, resulting in 1.53%, which shows huge demand and a limited supply of the crypto. The price of Bitcoin crypto is down by just 15% from its all-time high price.
As Bitcoin is the largest cryptocurrency globally, its market cap dominance is 51.85%. Also, the Total Value Locked for the crypto is worth $1.035 Billion, with 69.36 million holders.
Bitcoin Derivatives Data Analysis
Bitcoin has witnessed huge long liquidations for the last few days, showing sellers’ dominance in the price over the last few weeks.
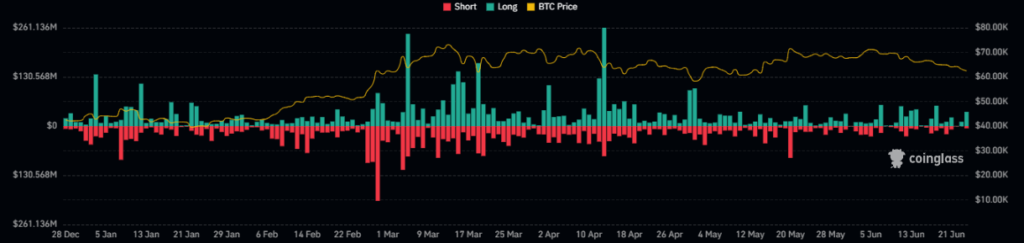
The derivatives trading volume for the Bitcoin crypto has witnessed a surge of 180% in just the last 24 hours from the press time. This has resulted in a traded value of $37.26 Billion, and the open interest in the crypto is trading flat.
Moreover, the long liquidation recorded for Bitcoin in the last 24 hours is $48.02 Million, followed by a short liquidation of $ 2.11 Million. This shows strong bear dominance in the crypto followed by strong profit bookings in longs.
BTC Crypto Technical Analysis
Strong declining momentum in Bitcoin crypto can be seen as the price of the BTC has declined by 15% in just 15 days.
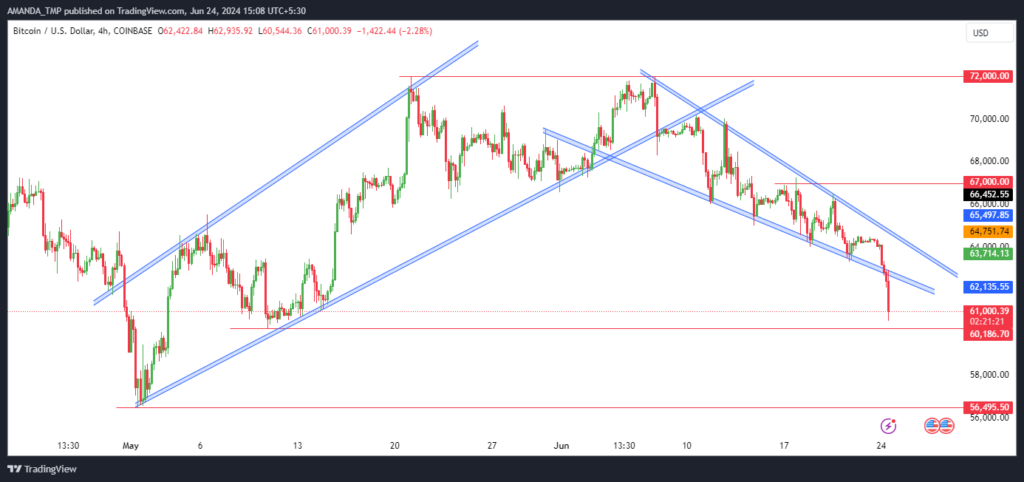
The technical chart of the BTC crypto shows that the price has declined below two wedge patterns on the chart, which shows the strong dominance of sellers in crypto.
From the beginning of May 2024 to the end of June 2024, the price of the BTC crypto was trading inside a rising wedge pattern. The price of the crypto later broke down below the wedge pattern.
After the decline in the pattern, the price of the crypto started to decline, further leading to a falling wedge pattern. The price of the BTC crypto further again has broken below the falling wedge pattern and has lower levels of targets pending in the market.
The 50-day and 200-day EMAs on the 4-hour BTC chart have formed a golden crossover, which is typically considered a bullish signal. However, the BTC price has recently dropped below the 200-day EMA, indicating a significant loss of bullish momentum.
Reinforcing this bearish outlook, the MACD indicator has issued a fresh sell signal. A bearish crossover between the MACD and the signal line has occurred, with both indicators now trading negatively.
Furthermore, the RSI reflects declining bullish momentum and increasing bearish pressure, currently standing at 28. This suggests oversold conditions, confirmed by the RSI breaking below the 14-day SMA.
Summary
Bitcoin’s price shows strong bearish momentum, declining 15% in 15 days and falling below key wedge patterns. Despite a golden crossover, it dropped below the 200-day EMA.
Indicators like MACD and RSI confirm bearish pressure, with a 2.5% market cap decline and significant long liquidations reinforcing the downtrend.
The support levels for Bitcoin are $56,500 and $60,200 which is further followed by resistance levels of $67,000 and $72,000.
Disclaimer
This article is for informational purposes only and does not provide any financial, investment, or other advice. The author or any people mentioned in this article are not responsible for any financial loss that may occur from investing in or trading. Please do your research before making any financial decisions.




