
 Wisp
Wisp Identity.md 6900
 Crawlerpad
 Bunker Mode
 Pearl
Pearl Starknet
 Quantus
- Algorand price has declined by 28.16% in the past 34 days.
- The ALGO token price has slipped below the key moving average, showing weakness.
Based on the chart structure, the ALGO price has performed negatively since mid-March. It has lost around 58% till now and has slipped below the major support level of $0.160.
In May, the Algorand crypto price attempted 4 times to overcome the 200-day EMA. However, the sellers won the battle and dragged the price below the major support level. The token asset price seems to have formed a bottom at $0.130.
Algorand was traded at $0.142 at press time, which rose 2.20% in the past 24 hours. The market capitalization was $1.23 Billion, and the 24-hour trading volume was $23.95 Million at the time of writing.
RSI Analysis
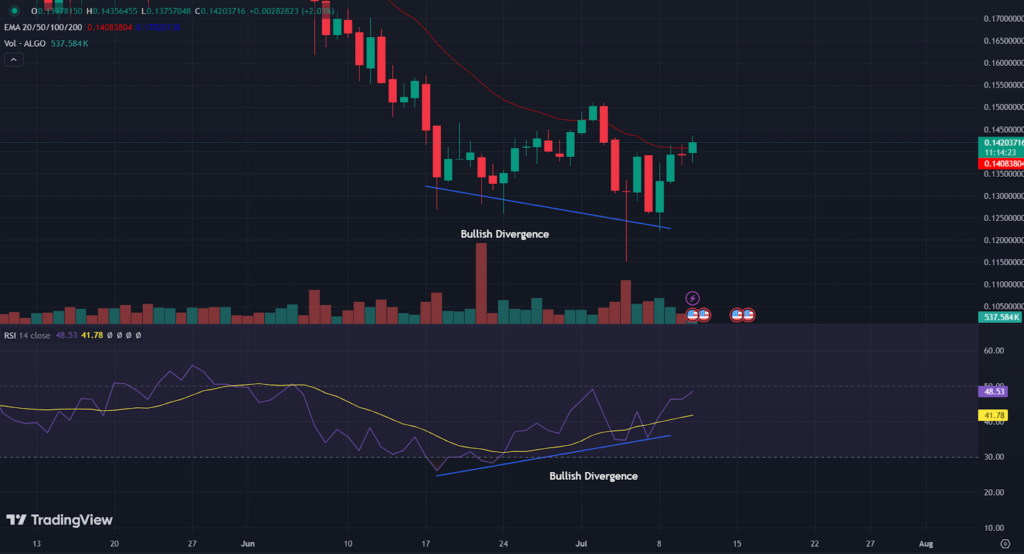
The Relative Strength Index (RSI) formed a bullish divergence and has gained bullish momentum at the time of writing. It is a sign of bullish momentum, and the price might shoot up soon.
Bullish Divergence | Source: TradingView
The RSI was at 49 when writing and had recovered from the oversold zone. It was heading toward the overbought zone. The RSI generated a golden crossover with the RSI-based moving average, as shown in the chart.
ALGO Price Technical Analysis Over Daily Timeframe
The Algorand price has declined for the past few months and seems to form a base near the $0.130 hurdle. Historically, the price triggered a breakout from this zone in November 2023 and surged by 70% in 3 weeks.
Suppose the crypto asset price slips below the $0.130 mark; it would be a selling opportunity. If the price starts trading below the $0.100 mark, the sellers may be eyeing an all-time low.
On the other hand, if the ALGO price takes support at the $0.130 hurdle, it might gain bullish momentum. Suppose the price exceeds the 20-day EMA, it may extend to the 200-day EMA.
Turning to the technical indicators, the MACD has generated a golden crossover with the Signal line and formed the green histograms. The ALGO crypto price is trading below the key moving average.
Performance
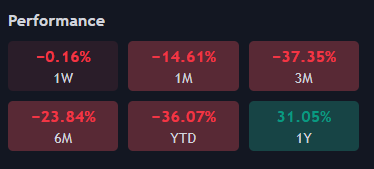
This chart shows that the Algorand token price has performed negatively for the short term but has remained green on a yearly basis.
Performance | Source: TradingView
It has dropped by 14.61% and 37.35% in a month. It has declined by 23.8% in the past 6 months but has gained 31.05% in a year.
ALGO Will Rebound, or There Will Be an All-Time Low?
ALGO has experienced a significant decline, slipping below the major support level of $0.160. The RSI has shown signs of bullish momentum, with a potential for the price to shoot up soon. Most of the technical indicators favor bullish momentum, but some favor a bearish forecast.
The $0.130 hurdle seems critical, as breaking below it could provide selling opportunities, while staying above it may lead to bullish momentum.
Technical Levels
Algorand’s price is expected to face resistance at the $0.160 and $0.240 levels. The price may take support at the $0.130 and $0.106 mark.
Disclaimer
This article is for informational purposes only and provides no financial, investment, or other advice. The author or any people mentioned in this article are not responsible for any financial loss that may occur from investing in or trading. Please do your research before making any financial decisions.




