
 Quack AI
 Pearl
Pearl Solana
 NEAR Protocol
 Canton
 XRP
XRP Derive
- Bitcoin price has generated a significant candlestick pattern on a daily time frame.
- The trading volume has increased by 30.80% in the past 24 hours.
The BTC price has performed a bullish trend since 2023 with a gain of 271% till the press time. After reaching an all-time high, the Bitcoin price has started consolidating and has defended the $50K hurdle.
Early June, BTC approached the $70K mark but did not cross it. That failed attempt resulted in a selling pressure of 22% in a month.
Since March, the digital asset price has been declining by taking support at the trendline. At press time, the BTC price has taken support on the trendline and has surpassed the 20–day EMA.
At press time, Bitcoin was being traded at $62,460 up by 2.75% in the past 24 hours. The market capitalization was $1.23 Trillion and the 24-hour trading volume was $27.92 Billion at press time.
Is BTC Correction Over?
A source claims that the BTC correction phase is over and is about to shoot up soon. On a weekly time frame, the price has grabbed the liquidity below the last swing high and surged by 14.70%.
#BTC
— Rekt Capital (@rektcapital) July 15, 2024
The Bitcoin correction is over$BTC #Crypto #Bitcoin pic.twitter.com/K8yBGTuNfZ
The price generated a bullish momentum on the $56K level, displaying bullishness. This may be a sign of a bullish forecast as it has emerged from the correction phase.
Technical Overview on 1-D Timeframe
Bitcoin price has formed a strong base at the $56K hurdle, displaying bullish momentum. If it sustains above the key moving averages, BTC may attract buyers.
If BTC manages to defend the $60K hurdle, strong buying pressure can be expected. The price over the crucial level of $60K may attract buyers for the $70K hurdle.
On the other hand, assuming the digital asset price starts trading below the 200-day EMA, buyers over the 200-day EMA might get trapped. Liquidity over the key moving average may witness a bearish trend.
RSI Analysis
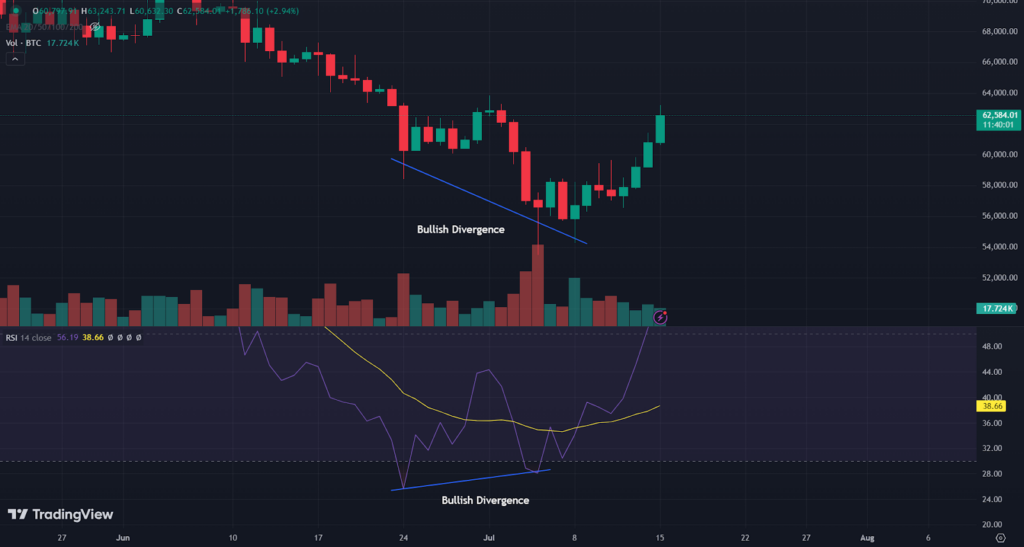
RSI has developed a bullish divergence on a daily time frame. This is a bullish sign and the price has also departed from the bottom and heading for a new high.
RSI is 56 and has generated a golden crossover with the RSI-based moving average. It is heading toward the overbought zone.
Bitcoin Price Planning for $70K Hurdle?
Based on the recent price movement, increased trading volume, and technical analysis, it seems that BTC is showing bullish signs. The price seems to have formed a strong base at the $56K hurdle and has shown bullish momentum. If the price manages to defend the $60K hurdle, strong buying pressure can be expected, potentially leading to a push towards the $70K mark. However, it’s essential to monitor its behavior with the 200-day EMA to assess the potential for a bearish trend.
Bitcoin crypto price is expected to take support at $56K and $52K levels during the bearish momentum. The price may face resistance from the $53K, $67K, and $71K mark.
Disclaimer
This article is for informational purposes only and provides no financial, investment, or other advice. The author or any people mentioned in this article are not responsible for any financial loss that may occur from investing in or trading. Please do your research before making any financial decisions.




