
 Quantus
 Pearl
Pearl Quack AI
 Starknet
 NEAR Protocol
 Zcash
Zcash Aerodrome Finance
- Mog Coin price has advanced by more than 44000% from its all-time low.
- The sentiment of the coin is also bullish, as per the analysts.
The Mog coin’s price exhibited a strong bullish behavior on the chart, followed by a strong surge in the price over the last few weeks.
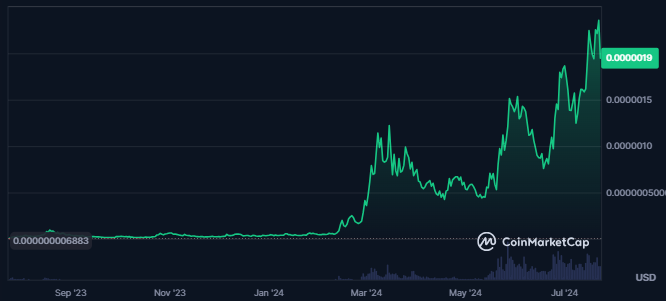
Price Overview Chart of MOG | Source: CoinMarketCap
Although the price sentiment of the token was bullish, its market cap has declined by 13% in the last 24 hours. It dropped to $695.030M, making it the 95th largest cryptocurrency in the global crypto market.
When writing, the value of the traded volume for the coin also declined 35% over the last 24 hours. It was $34.05M, and MOG’s volume/market cap ratio was 5.0%.
The coin’s circulating supply was 360.447T MOG, 85.68% of the maximum supply at press time. The fully diluted market cap of the coin was $811.86M, and the maximum supply of the coin was 420.69T MOG.
Following the current trading price of the Mog coin, 88% of the holders were in profit. Additionally, the large holders’ concentration of the coin was 68%, but only 2% of the holders held it for more than 1 year.
Mog Coin Derivatives Data Analysis
The long/short ratio of the Mog coin was 0.9324, which resulted in a higher long liquidation over the last 24 hours at press time.
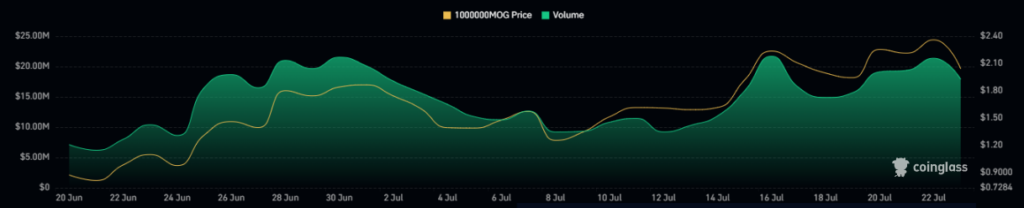
Mog Coin Derivatives Volume Chart | Source: Coinglass
The derivatives volume of the MOG coin had witnessed a huge surge over the last few days, showing an advance in the coin’s trading activity.
The short liquidation recorded for the coin was worth $41.10K, whereas the short liquidation was only $254.03. It showed higher profit booking of longs in the coin over the last 24 hours.
MOG Coin Technical Analysis
On the daily chart of Mog Coin, a series of higher high swings were observed, indicating a consistent upward trajectory in the coin’s price.
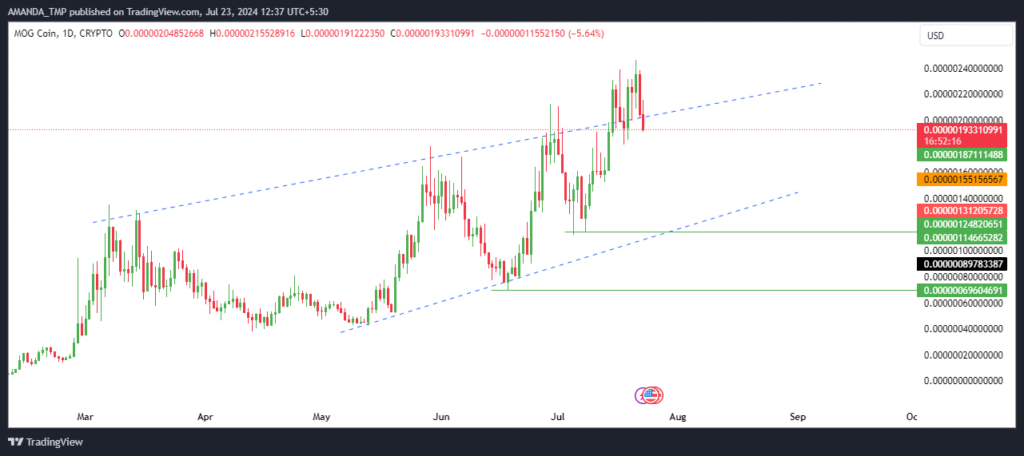
MOG Coin Daily Price Chart | Source: TradingView
This pattern of higher highs suggests strong bullish sentiment among investors, leading to a notable surge in value over time. The observed price behavior contributed to a rising pattern, signifying a robust and sustained uptrend.
Recently, Mog Coin experienced a significant technical breakout, surpassing the upper boundary of a wedge pattern. This breakout was accompanied by a marked increase in trading volume and momentum, further validating the strength of the upward move.
MOG/USD Chart by TradingView
Mog Coin has shown impressive technical strength by advancing above the 20-day, 50-day, and 200-day exponential moving averages (EMAs). This movement resulted in the EMAs forming a golden crossover, a bullish indicator that signals a potential for continued upward momentum.
The Moving Average Convergence Divergence (MACD) indicator and its signal line moved into a bullish trajectory, trading in a golden crossover. The histograms on the chart also supported the bullish sentiment. That reinforced the presence of bulls in the market.
The Relative Strength Index (RSI) entered the overbought zone, breaking above the 14-day Simple Moving Average. That indicated strong momentum in Mog Coin’s price.
Mog Coin witnessed a Surge of over 44000%
The MOG price surged over 44000% from its all-time low, displaying strong bullish behavior.
Despite a recent 13% decline in market cap, technical indicators like golden crossovers and a rising RSI signaled the continuation of upward momentum. With 88% of holders in profit, the bullish sentiment remained robust.
Key support levels for MOG were identified at $0.000000690 and $0.000001140 at press time, while resistance levels were positioned at $0.00000250 and $0.0000030, providing important price points to watch for potential market reactions.
Disclaimer
This article is for informational purposes only and does not provide any financial, investment, or other advice. The author or any people mentioned in this article are not responsible for any financial loss that may occur from investing in or trading. Please do your research before making any financial decisions.




