
 Crawlerpad
 Aerodrome Finance
 Zylo Ecosystem
 Wisp
Wisp Pearl
Pearl Sonic
Sonic Quantus
- The DYDX price has melted by 63% since April, indicating the bears’ grip.
- The RSI has generated a bearish crossover, which showcased the bearish momentum.
- Its trading volume has dropped by 56% in the past 24 hours.
Based on the chart structure, the dYdX price has witnessed strong selling pressure from mid-April.
During this bearish trend, the price recorded an all-time low of $1.05 on July 05. It has lost 72.21% from its all-time high and gained 22.92% from its all-time low.
Historically, the dYdX price has defended the psychological level of the $1 mark thrice. In the first week of July, the price showed a price rejection from the $1 mark.
It has formed a hammer candlestick and has surged by 43% within 10 days.
At press time, the dYdX crypto traded at $1.25, which declined by 2.89% in an intraday session. The market capitalization was $762.65 Million, and the 24-hour trading volume was $19.01 Million.
The circulating supply at the time of writing was 605,962,307 dYdX, and the fully diluted market cap was $970.17 Million.
Death Crossover in RSI
The RSI has developed a death crossover with the RSI-based moving average, which signed a bearish forecast.
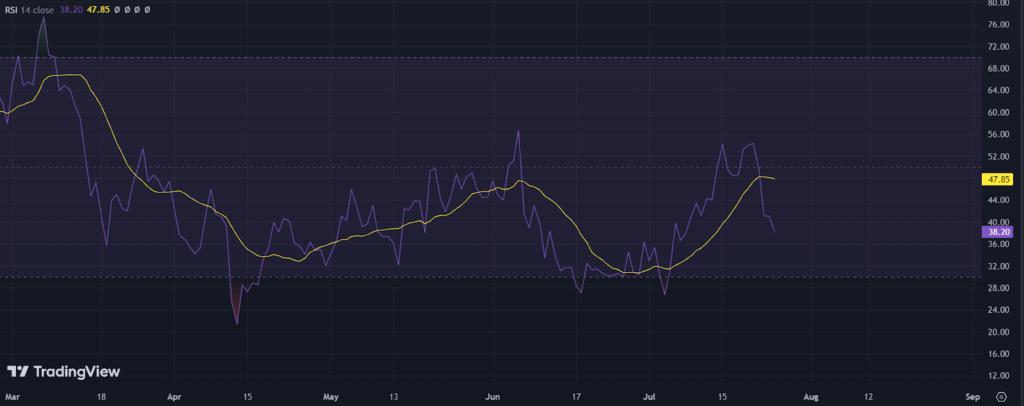
The RSI was 38 and had returned from the middle band. It was heading towards the oversold zone.
Huge Rally After Breakout?
A source on X suggests that a huge rally in the DYDX crypto price is anticipated after the breakout from the descending channel. The price has been falling through a descending triangle pattern.
$DYDX
— monkey$money (@PrivateAveen) July 24, 2024
UPDATE
Huge rally will going to occur once btc new high session $Dydx is very bullish keep an eye on it pic.twitter.com/oCF9kg5FDK
According to this source, once the BTC price reaches a new higher session (exceeds the $72K mark), it may positively impact the dYdX crypto price. During this situation, the DYDX price may trigger a breakout and shoot up after the retest.
Technical Analysis of DYDX on a Daily Timeframe
The dYdX price has formed a hammer candlestick pattern on the daily time frame by defending the psychological level of $1. The price had surpassed the 20-day EMA but failed to sustain for longer.
The crypto asset price has declined over the past few months by forming lower lows and lower highs. The price has formed a bearish candlestick in the lower high territory, which might invite sellers for a new lower low.
On the other hand, buying momentum can be seen if the price bounces back and surpasses the 20-day EMA. Assuming the digital asset price overcomes the $2 hurdle, it might be a sign of a trend reversal.
Could DYDX Price Recover From Bottom?
The dYdX price has been under significant selling pressure, leading to a decline of 63% since April. The RSI has also generated a bearish crossover, indicating a bearish momentum.
However, the price has defended the $1 mark multiple times and showed a rebound after forming a hammer candlestick. The RSI is at 38 and heading towards the oversold zone, suggesting a bearish forecast.
Technical Levels
The dYdX crypto price is expected to face resistance from the $1.45 and $1.85 levels. The price may take support at the $1.25 and $1.00 mark.
Disclaimer
This article is for informational purposes only and provides no financial, investment, or other advice. The author or any people mentioned in this article are not responsible for any financial loss that may occur from investing in or trading. Please do your research before making any financial decisions.




