
 streamoors
 IGNITION
 Sword Inu
 no crying in the casino
 Altai the Tiger
 Pearl
Pearl Pudgy Penguins
- Jito token’s price rose by 22% on July 26, showing buyers’ accumulation.
- The JTO price has surpassed the key moving averages, displaying the bulls’ dominance.
The JTO price has almost remained neutral throughout this year and has attempted to overcome the $5 mark twice. It failed to exceed the $5 hurdle and displayed bearish momentum.
Since mid-May, the crypto asset price has experienced selling pressure and dropped due to resistance from a trendline. The Jito price triggered a breakout from the trendline in mid-July and performed positively.
In terms of technical indicators, the Jito price has advanced the key moving averages, demonstrating the buyers’ interest. The RSI has developed a bullish divergence at the bottom and risen to the overbought zone.
Can the Jito Token Price Gain a Double-digit Value?
In his X post, a reputed crypto trader, KNIGHT $INJ TO 100$ (@cryptoknight890), claimed that the Jito price could shoot up soon and reach $4, $6, $8, and $10 levels.
$jto going for double digits
— KNIGHT $INJ TO 100$ (@cryptoknight890) July 27, 2024
4⏳, 6⏳ ,8 ⏳, 10⏳ https://t.co/OgNPcHzv9r pic.twitter.com/voAmFmIEdM
The price seemed to have defended the bottom and gained bullish momentum. It surpassed the 200-day EMA, which might boost the bullish trend.
JTO Price has Shaped a Double-bottom Pattern
The Jito price has developed a double-bottom pattern, per the chart structure. The 2nd leg has resulted in a gain of 74% in the past 3 weeks. It has surpassed the 20-day EMA during this momentum.
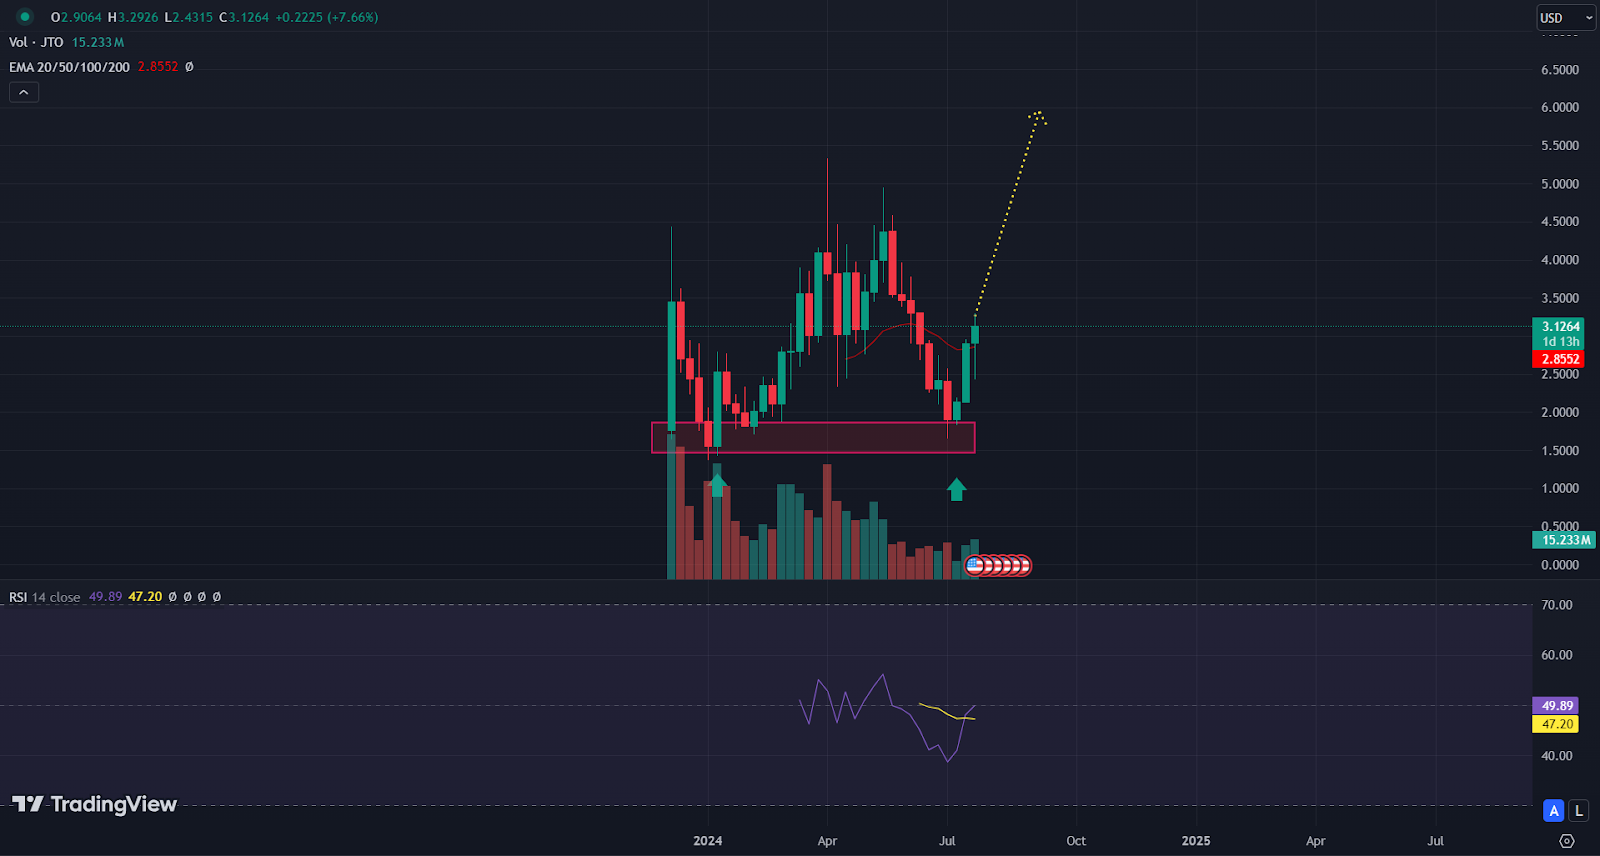
Buyers might get confident if the JTO price manages to defend the 20-day EMA. The price got enough push for the bullish momentum. If the chart structure attracts investors, JTO may shoot up soon to a double-digit level.
Assuming the digital asset price slips below the 20-day EMA, buyers might panic, and panic selling might start. Due to the panic selling, the Jito crypto price may face bearish momentum and melt to the $2 level.
Technical Analysis of the JTO Price in a Daily Timeframe
The Jito crypto traded at $3.16 at press time and lost 1.92% in the past 24 hours. The market capitalization was $393.07 Million, and the 24-hour trading volume was $121.94 Million.
The technical chart displayed that the Jito price has shown weakness for the past few months. It has generated a ‘Hammer’ candlestick in the demand zone and managed to trigger a breakout from the trendline.
Recovery from the demand zome may lift the price to the last swing high. Besides this, if the price slips below the 200-day EMA, selling pressure might be unavoidable.
Will the JTO Price Rise or Sink Further?
The recent bullish momentum in JTO price and the technical indicators suggested that the price could reach higher levels, possibly even into the double digits. The double-bottom pattern and the recent gain in the past few weeks indicate positive sentiment among buyers.
However, keeping an eye on the 20-day EMA is essential as it could serve as a confidence booster for buyers or trigger panic selling if the price slips below it.
Technical Levels
The Jito crypto price is expected to face resistance from the $4.00 and $5.00 levels. The price may take support at the $2.50 and $1.85 mark.
Disclaimer
This article is for informational purposes only and provides no financial, investment, or other advice. The author or any people mentioned in this article are not responsible for any financial loss that may occur from investing in or trading. Please do your research before making any financial decisions.




