
 WASTED
 Official Trump
 Bitcoin
 Pearl
 Pieverse
 Venice Token
 Pudgy Penguins


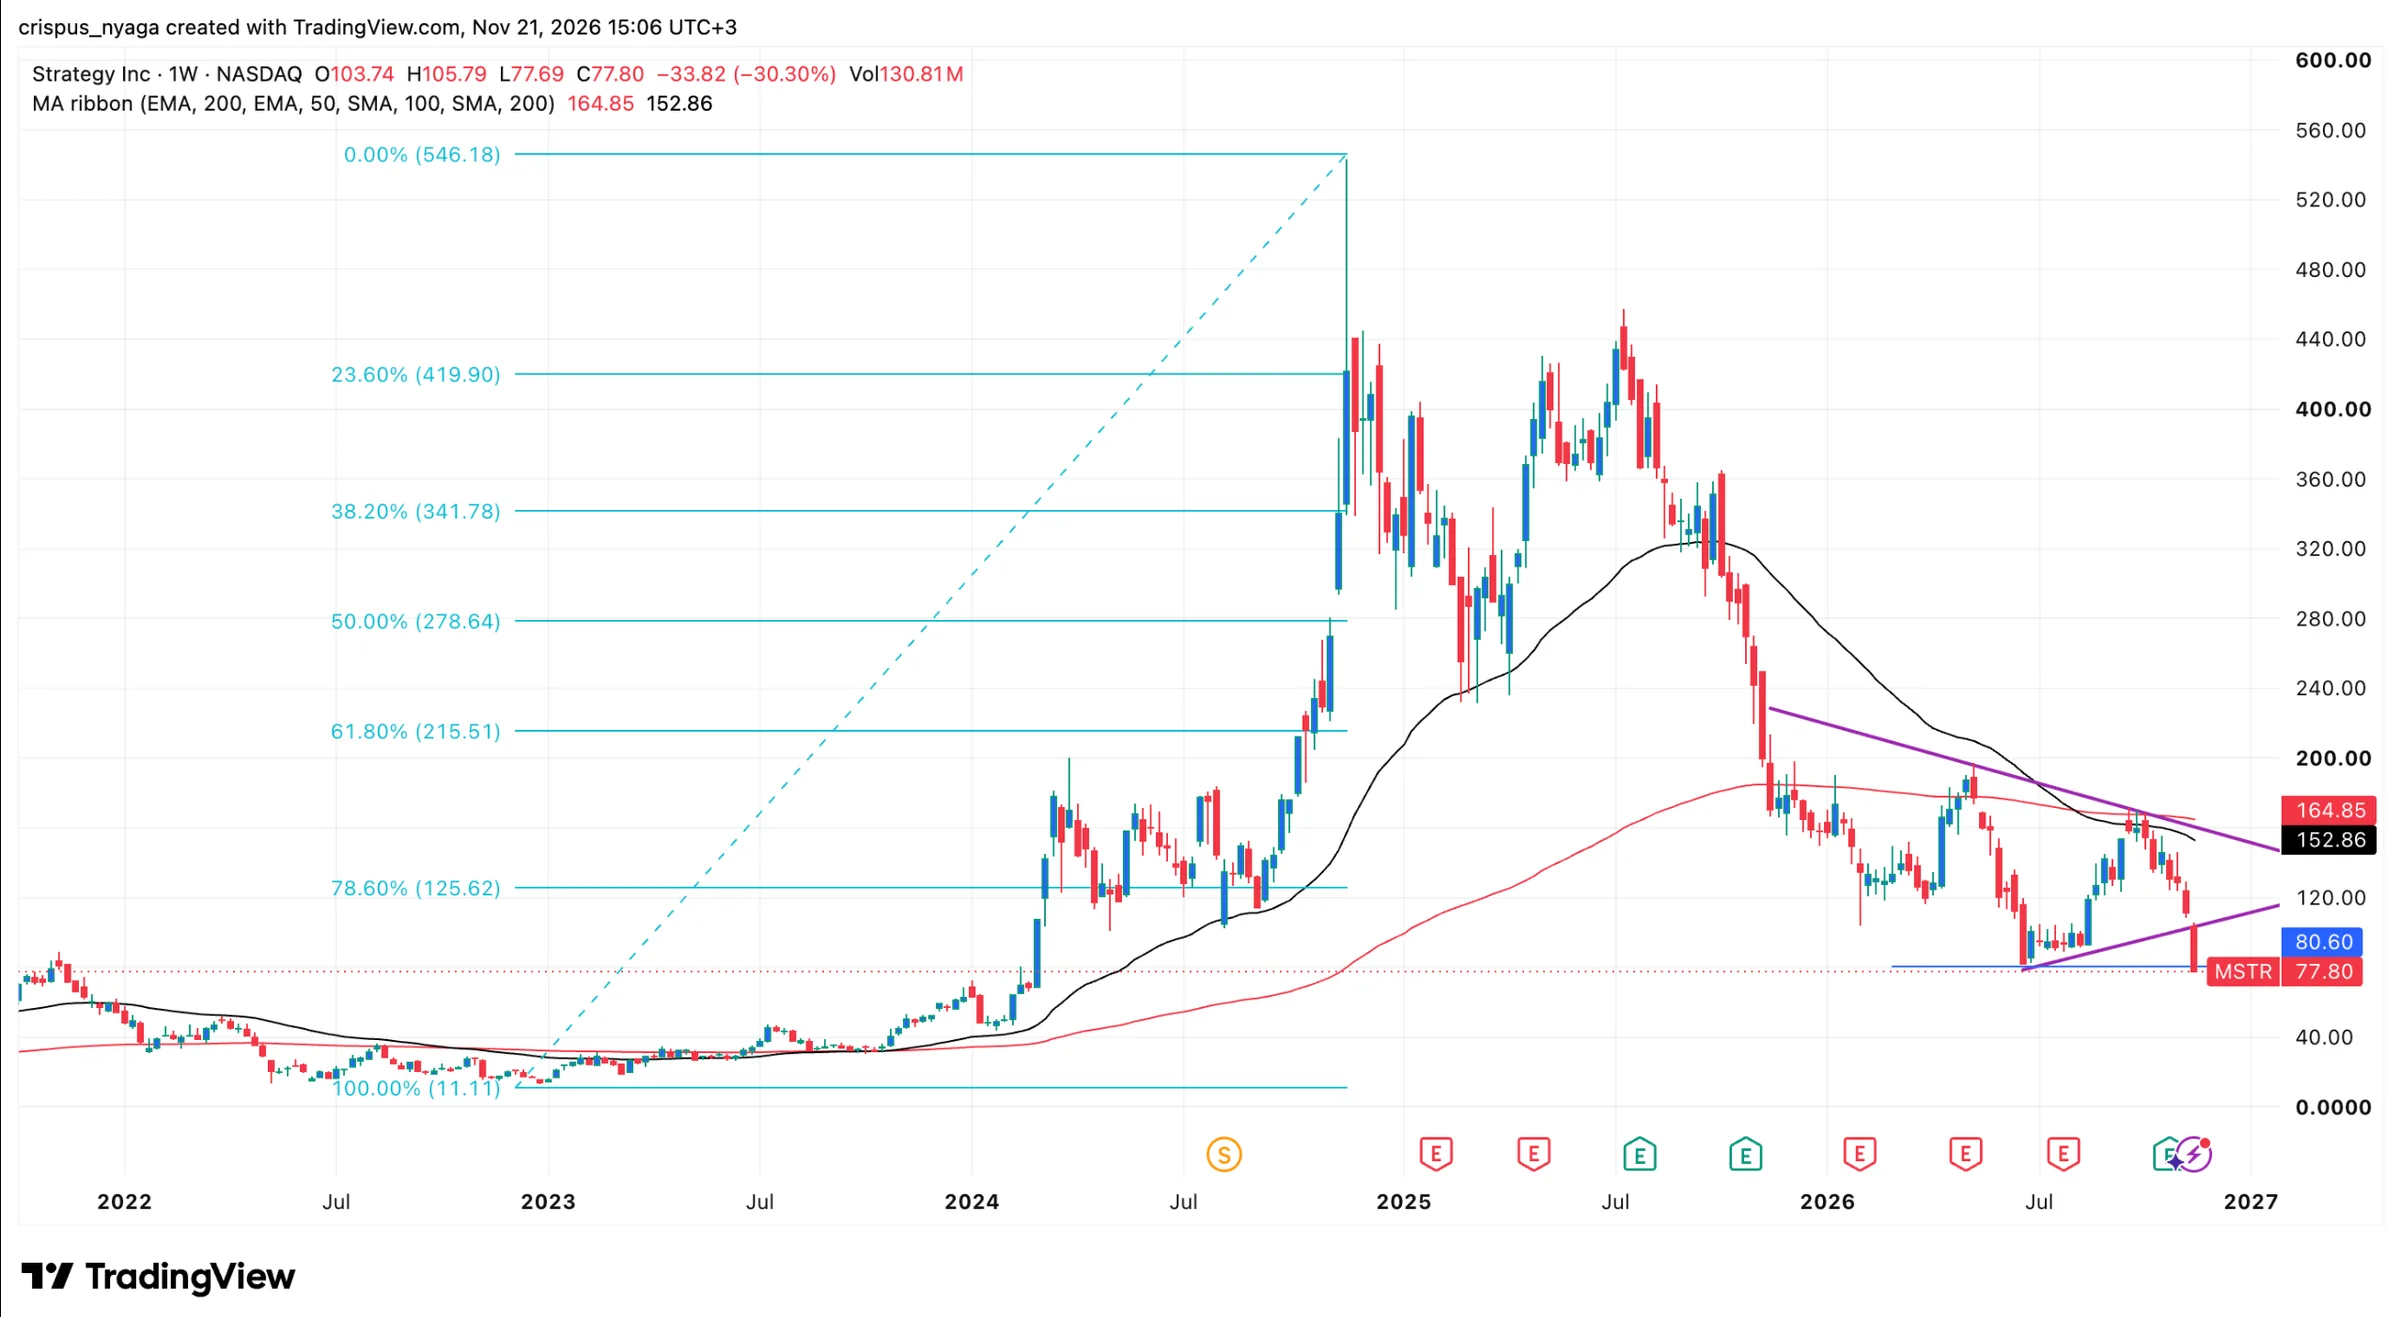
MSTR stock fell below $80 on Friday, Nov. 20, as Bitcoin extended its November decline. Strategy shares closed at $77.80, losing 9.67% during the session.
The drop coincided with persistent withdrawals from U.S. spot Bitcoin exchange-traded funds (ETFs). These products recorded approximately $3.47 billion in net outflows through Nov. 19, according to SoSoValue data cited by The Block.
Meanwhile, Strategy continued holding 850,849 BTC, leaving its investment portfolio exposed to Bitcoin’s market movements.
MSTR Stock Has Plunged Below Key Support Levels
The weekly chart shows that the MSTR stock has been in a strong sell-off in the past few days. It has just crossed the important support level of $80, a sign that bears have prevailed.
The stock is attempting to move below the crucial support level of $77.80, its lowest level on June 22nd. It has fallen below the 78.2% Fibonacci Retracement level.
Most notably, the stock formed a death cross pattern in August. This pattern is characterized by the 50-week and 200-week Exponential Moving Averages (EMA) crossover. It has also plunged below the Supertrend indicator.
Therefore, the stock will likely continue falling, potentially to the next psychological level of $50, which is about 34% below the current level.
Bitcoin ETF Outflows are Rising as Liquidations Jump
The ongoing MSTR share price crash has coincided with the ongoing Bitcoin ETF outflows. Data shows that spot BTC ETFs lost over $582 million on Thursday, a figure that likely continued on Friday. These funds have had over $3.47 billion in outflows this month. BlackRock’s IBIT has been the most affected, with its cumulative inflows since inception standing at $47 billion.
The ongoing Bitcoin ETF outflows coincided with rising liquidations across the cryptocurrency market. Bitcoin liquidations exceeded $1.17 billion, with long positions accounting for 88.5% of the total. Across the broader crypto market, liquidations reached $2.56 billion over 24 hours, reflecting mounting pressure on leveraged traders.
These events are happening at a time when fear is spreading in the crypto and the stock market. The CNN Money Fear and Greed Index has dropped to the extreme fear zone of 10. It has moved from the year-to-date high of 71.
Similarly, the Crypto Fear and Greed Index has moved to the extreme fear area of 7, its lowest level in months. All this is a sign that investors are fearful and are accelerating dumping their assets.
Strategy is highly exposed to Bitcoin’s weakness because of its large holdings. It bought more coins last week, bringing its holdings to 850,849. Its Bitcoin holdings are now valued at over $49 billion, down sharply from the year-to-date high of over $70 billion. As such, the more BTC drops, the more the company’s balance sheet is affected.
All this is happening at a time when Strategy has continued diluting its shares as it continues its STRC repurchases.
Bitcoin Price Prediction: Technical Analysis
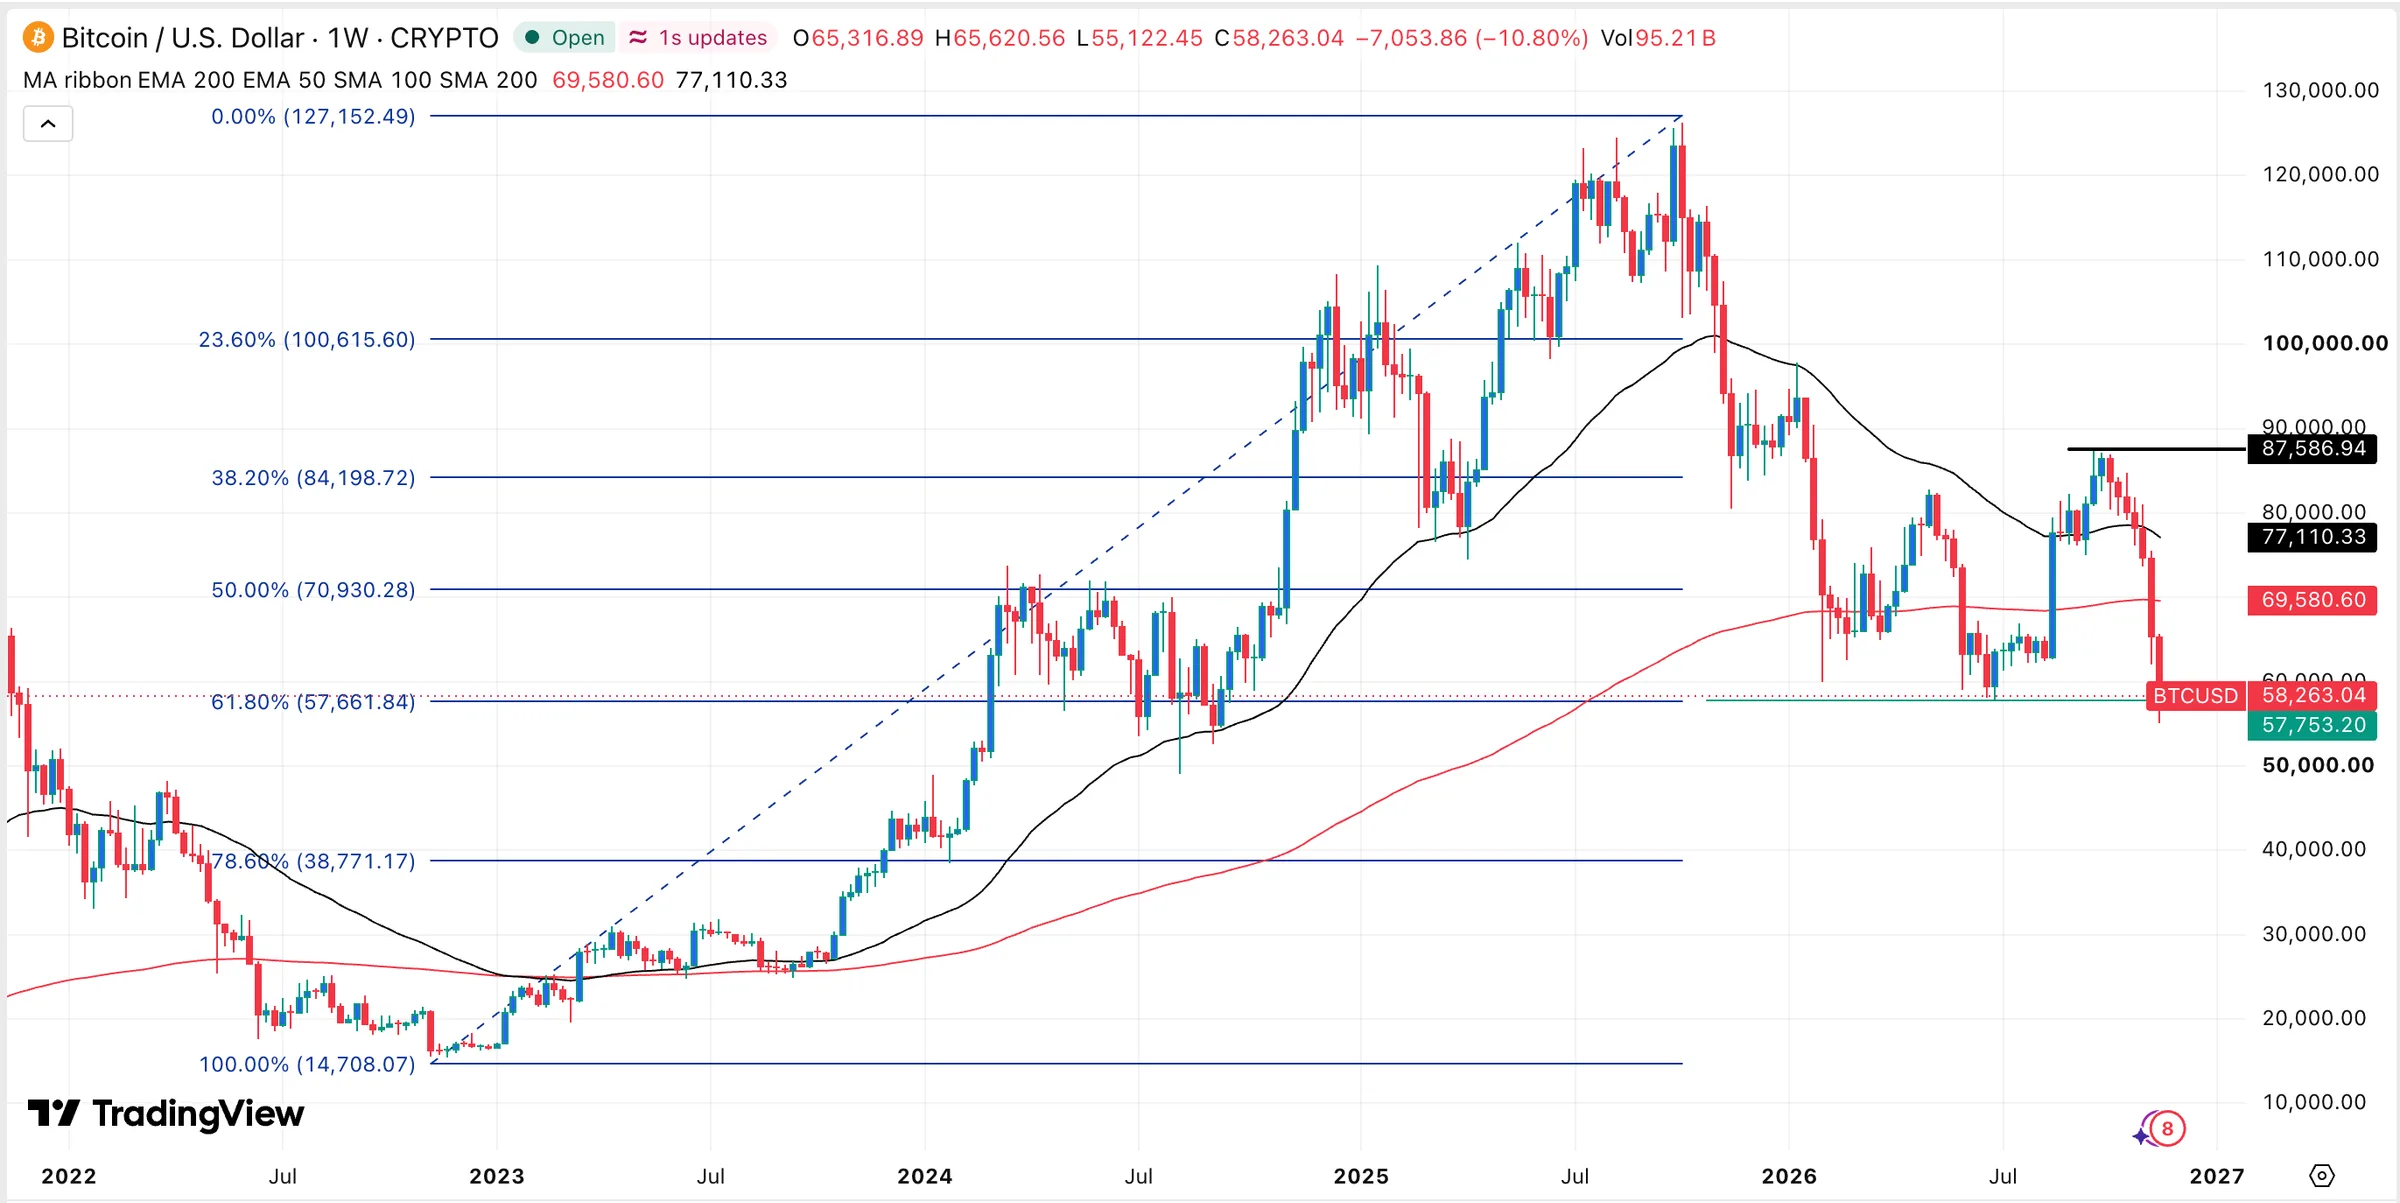
The weekly chart shows that Bitcoin has slumped and reached a crucial support level. This price coincides with the lowest level in June this year. It also coincides with the 61.8% Fibonacci Retracement level.
The coin has slumped below the 50-week and 200-week moving averages, which is a sign that bears are winning. Most notably, the coin has remained below the Supertrend indicator.
Therefore, the coin will likely have a strong bearish breakout, with the next key target to watch being at $50,000. Plunging below that level will point to more sell-off, potentially to the 78.6% Fibonacci Retracement level of $38,770. A move above the 200-week moving average of $69,578 will invalidate the bearish outlook.
This article provides general financial information, not investment advice. Stock and cryptocurrency prices fluctuate, and technical forecasts cannot guarantee future returns. Investors should conduct independent research before making investment decisions.