
 Pearl
Pearl Bitcoin
 NEAR Protocol
 Starknet
 Solana
 Quant
Quant Ondo
Ondo
- VET token price advanced by 1300% from its all-time low price.
- The VeChain token price sentiment was bearish, as per the analysts.
The VeChain token’s top 10 holders held 41.43% of the total supply. Also, the token’s total supply was 85.985B VET, and 93.39 of it was circulated in the market at press time.
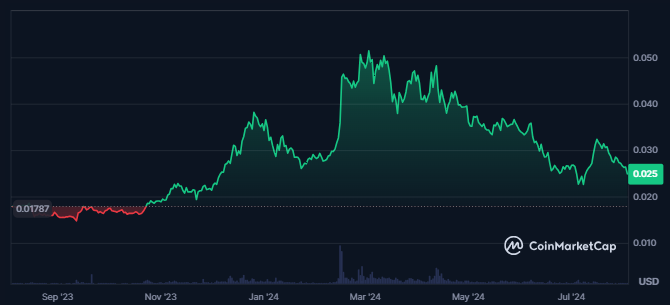
Price Overview Chart of VET | Source: CoinMarketCap
The VeChain token price was highly volatile, resulting in a volatility of 9.67%. The token’s market cap dominance was 0.08%, which shows its strong presence. The fear and greed index of the token was at 37, which showed fear among the token investors.
The VeChain token’s market cap witnessed a slight decline of 1.9%, which resulted in a market cap value of $2.015B. Also, the token’s market cap ranking was #40, according to CoinMarketCap.
Despite the decline in the market cap, the token’s traded volume value advanced by 7.8%. This resulted in a traded value of $34.297M, which was just 1.75% of the market cap, showing low liquidity in the token price.
The Total Value Locked for the VeChain token declined to $534.7K over the last few months. This showed a decline in the project investment of the token and a decline in the investors’ confidence.
VeChain Token Derivatives Data Analysis
The VeChain token price faced the dominance of bears and witnessed consistently higher long liquidations in the token.
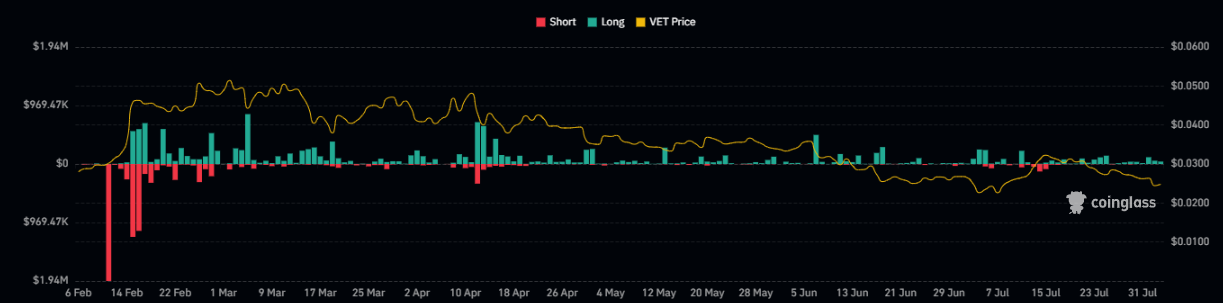
VeChain Token Derivatives Liquidation Chart | Source: Coinglass
A surge of 9.2% in the token’s derivatives traded volume was recorded, which resulted in a traded value of $27.44M. The open interest of the token further declined by 2.4%, which showed a decline in the token’s open positions.
The recorded long liquidation for the token was worth $83.33K. On the other hand, only $1.74K shorts were liquidated in the last 24 hours.
VET Token Technical Analysis
Over the last five months, VET has experienced consistent profit booking, resulting in a 55% decline in its price.
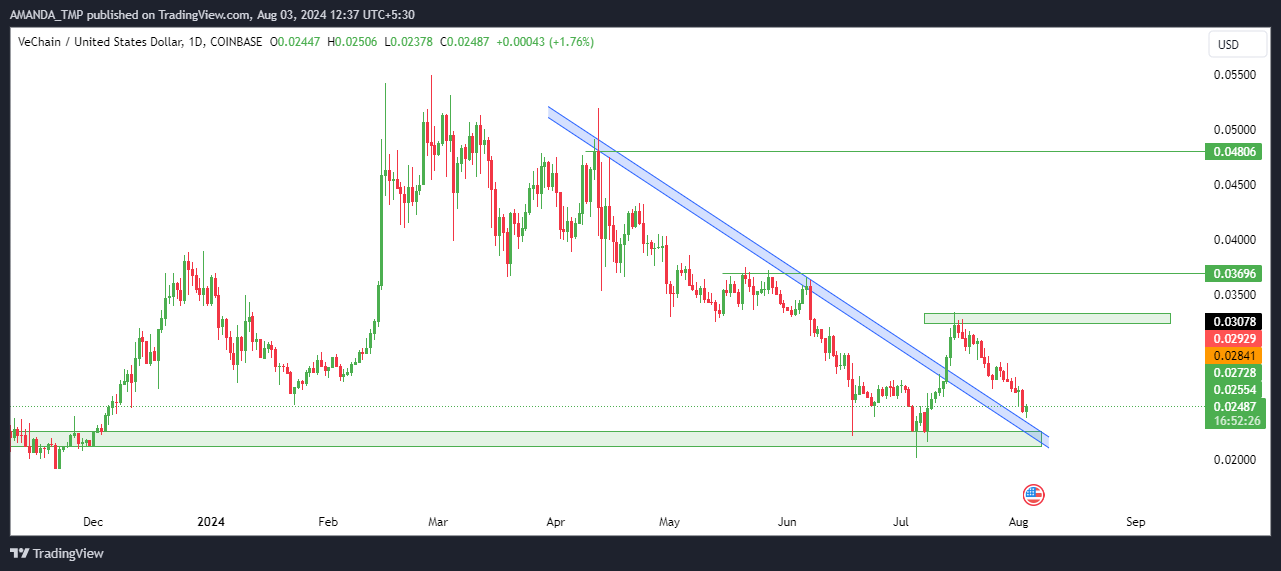
VET Token Daily Price Chart | Source: TradingView
This downward trend led to the formation of a dynamic trendline, which was followed by horizontal support levels. Additionally, a significant change of character level is situated at $0.033, highlighting a critical point for market participants.
Despite these challenges, the token price broke out above a descending triangle pattern. However, it failed to sustain the higher levels, leading to renewed profit booking.
This inability to maintain the breakout suggested continued volatility. It indicated the potential for further downward pressure on VET’s price in the near term.
VeChain Token Technical Indicator Analysis
The VET token price traded below the 50-day and the 200-day EMAs for a long time. A death cross followed this in the EMAs.
VET/USD Chart by TradingView.com
The MACD and the signal line traded in a death cross, and both metrics declined below the negative trajectory. The histograms on the charts were also negative, which exhibited a bearish sentiment.
RSI also declined below the 50-level and the 14-day SMA and sustained below the same for a long time.
The support levels for the VeChain token are $0.020 and $0.0230, followed by the resistance levels of $0.0330 and $0.040.
Disclaimer
This article is for informational purposes only and does not provide any financial, investment, or other advice. The author or any people mentioned in this article are not responsible for any financial loss that may occur from investing in or trading. Please do your research before making any financial decisions.




