
 Quack AI
 NEAR Protocol
 Zcash
Zcash Celestia
 Pons
Pons Pudgy Penguins
 Bitcoin
MD: Fetch.ai (FET) token faced a massive decline, falling 75% from its all-time high, with significant short liquidations.
- Massive short liquidation was recorded in the Fetch.ai token.
- The FET token price was down by 75% from its all-time high level.
The Fetch.ai token got a very solid security score of 90.12. It also belonged to the AA tier, as per CertiK Skynet. The security ranking of the token was #88, and the governance score of the token was also strong.
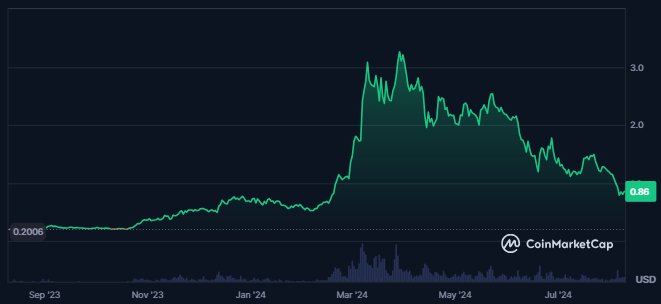
The market cap of the Fetch.ai token had witnessed an advance of 0.96% in the last 24 hours. It has consistently declined over the previous few days. Furthermore, the crypto’s market cap ranking was #35, as per CoinMarketCap.
The trading volume of the crypto further witnessed an advance of 20.7%. This led to a traded value of $163.235M in the last 24 hours. That resulted in medium liquidity, as 7.5% of the crypto market cap was traded.
The circulating supply of the token at press time was 2.520B FET, which is 95.8% of the maximum supply. The maximum supply of tokens was 2.630B FET, resulting in a fully diluted market cap of $2.257B.
What Do Derivatives Indicate About the Fetch.ai Token?
The derivatives volume for Fetch.ai slightly declined by 0.06% in the last 24 hours, resulting in a traded value of $132.66M.
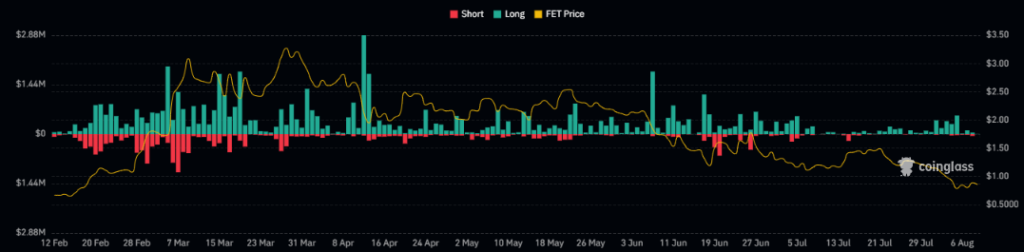
The crypto’s liquidation chart showed huge, consistent longs being liquidated in the token during the last few days. It indicated the sellers’ dominance.
Additionally, in the last 24 hours, the liquidated longs for the crypto were worth $10.57K. In contrast, the short liquidation for the token was valued at $51.20K.
FET Token Technical Analysis
The FET token price traded in a strong downtrend, followed by a breakdown below the symmetrical triangle.
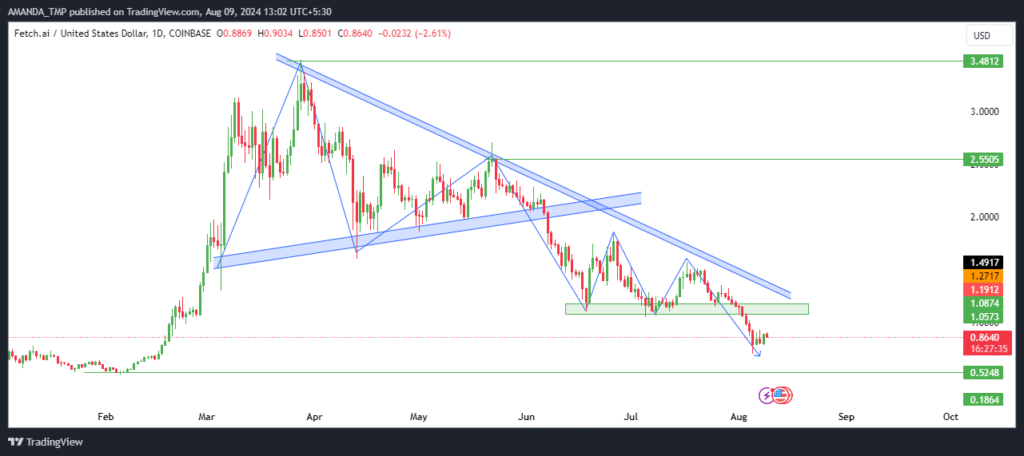
The FET token price witnessed consistent profit booking from the end of March 2024. A lower low swing on the daily chart of the token appeared.
Additionally, a solid support level was formed at the lower levels, again broken down a few days ago.
That continuous decline in the token price exhibited strong bearish behavior. It showed that the FET token price might continue declining to a lower level.
Fetch.ai Token Technical Chart Overview
The FET token price has consistently traded below the 50-day and 200-day EMAs over the last month. It exhibited a strong downtrend, and both EMAs traded in a death crossover on the chart.
FET/USD Chart by TradingView
The MACD and the signal line traded in a death crossover and sustained the negative trajectory for a long time. Also, strong bearish histograms were formed on the chart, supporting the price downtrend.
The RSI also traded in the negative territory and sustained below the 14-day SMA for a long time. When writing, the price traded at a level of 33 and hit the oversold zone a few days ago.
The FET token price might take support at $0.180 and $0.520, and it may face resistance at $2.50 and $3.40 levels.
Disclaimer
This article is for informational purposes only and does not provide any financial, investment, or other advice. The author or any people mentioned in this article are not responsible for any financial loss that may occur from investing in or trading. Please do your research before making any financial decisions.




