
 Dacity Coin
 Bitcoin
 Pearl
Pearl NEAR Protocol
 Quantus
 Bittensor
 Pudgy Penguins
- BRETT token price action guides the sustained selling pressure.
- Market indicators like RSI and MACD indicators were projecting bearish pressure.
BRETT, the leading meme coin on the Base Network, exhibited signs of bearishness. It has continued to underperform and persisted in eroding gains inside the falling channel.
Losing more than 40% of gains in a month, the memecoin experienced severe selling pressure. It has undergone a bearish momentum on the chart.
While few memecoin took a slight upmove this week, BRETT’s price remained negative and showed signs of bearish pressure. It seems to have reached a support zone, where a fresh price rebound can be seen ahead.
Its chart structure is still bearish, following lower high and lower low swings over the past few weeks. A push below the $0.0600 mark would trigger a next wave of correction, and the memecoin may retest the $0.04000 mark in the short term.
BRETT Represents Bearish Moves: What’s On The Cards Ahead?
On the one-day chart, the memecoin exhibited a sustained down-move. Correcting over 56% from its All-Time-High (ATH) of $0.1939, the memecoin has experienced a severe profit booking from the peak.
At press time, the BRETT token was trading at $0.08008 with an intraday surge of 1.26%. It reflected a minor pullback on the charts. It has a monthly return ratio of -32.09% and 328.20% yearly, reflecting short-term correction.
The pair of BRETT/BTC is at 0.00000133 BTC, and the market cap is $785.37 Million. Analysts are neutral and suggest that the BRETT price may continue to face bearish pressure ahead.
BRETT Price Chart | Source: Santiment
BRETT’s Relative Strength Index (RSI) hovering in the oversold region, noted at 34, signified a negative divergence.
A Tweet by @NFTdavie | Source: X
Similarly, the CMF stayed close to the midline region, noted at -0.02. The flat movement amid price decline reinforces the likelihood of an imminent market reversal.
A fresh, bullish reversal could not be seen until the token crosses the upside mark of $0.1000. A daily close above the overhead trendline mark of $0.1130 may permit the bulls to spark the bullish rally ahead.
Weighted Sentiment and Social Dominance Data Overview
The Weighted sentiment data observed a negative value, dropped below the zero line, and showed fear among the investors.
With the ongoing price correction, its holders have looked into a dilemma and were panicking.
Social Dominance Data Source: Santiment
Despite the price decline, the social dominance data exhibited a significant rise, conveying the rise in the media buzz for BRETT. The rising curve implied the increasing chatter among the investors and heightened online discussions on the media platforms.
Liquidation Data Favours The Decline
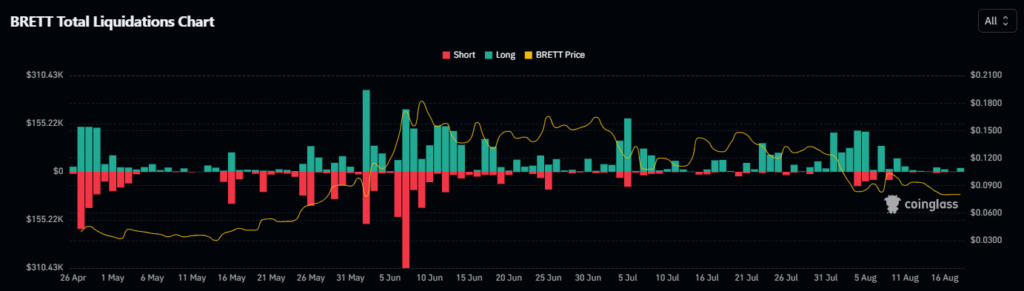
At press time, the long liquidations were noted at $12.35k, whereas the short liquidations were noted at $1.20k. This large, long liquidation implies a bearish sentiment.
However, the futures Open Interest (OI) rose over 1.20% to $18.82 Million, signifying the addition of long positions in the last 24 hours.
If the BRETT token continues to trade with a bearish bias, it may reach $0.07600. This would be followed by a 52-week low mark of $0.0600 in the short term.
Conversely, if the token follows the bullish reversal, it may form bullish swings. This further could reach the resistance mark of $0.08200, followed by the $0.0860 mark.
Disclaimer
This article is for informational purposes only and does not provide any financial, investment, or other advice. The author or any people mentioned in this article are not responsible for any financial loss that may occur from investing in or trading. Please do your research before making any financial decisions.




