
 streamoors
 IGNITION
 Quantus
 Sui
Sui Zcash
Zcash Ethereum
 Pearl
Pearl
- A surge of 42% in the AAVE token’s incentives was recorded in the last 30 days.
- AAVE was one of the top 50 cryptocurrencies in the global crypto market at press time.
The Aave (AAVE ) token’s community sentiment was bullish as per CoinMarketCap, and its market cap was valued at $1.979B. It further advanced by 7.6% in the last 24 hours from the press time. Additionally, the token’s market cap was worth $1.98B at the time of writing.
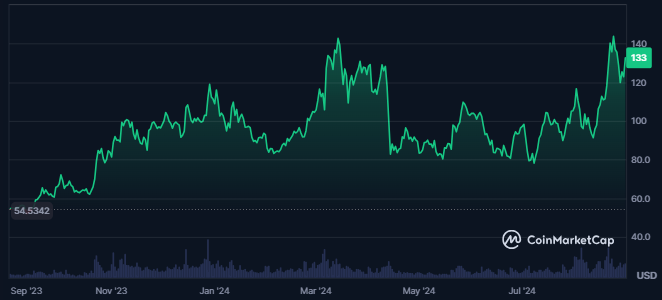
AAVE crypto was the 40th largest cryptocurrency in the global crypto market, with a market cap dominance of 0.09%. The token’s price was highly volatile, resulting in a volatility of 13.44%. This could be a sign of uncertain spikes in the token price for the future.
The token’s market sentiment was bullish, as per CoinCodex. Also, the fear and greed index was 29, showing fear among the token’s investors. The supply inflation of the AAVE crypto further was medium, resulting in 2.75%.
The AAVE price increased by 42% in the token’s traded volume, resulting in a traded value of $201.253M. This showed a huge liquidity in the token price, as 10.14% of the token’s market cap was traded in the last 24 hours.
What Does Financial Data Of AAVE Token Indicate?
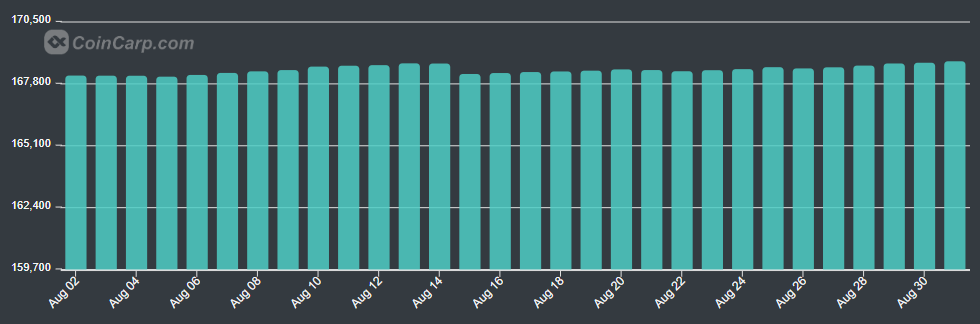
The AAVE token had 168K holders when writing; its top 10 holders held 54.51% of the total supply. Additionally, a surge in token holders was recorded in recent days.
The token’s 57% of the total holders were in profit. This was followed by 39% of the holders out of the money, and the concentration of large holders was 80%.
77% of the token’s total holders held the token for over 1 year. Moreover, 4% of the holders held it for less than 1 month.
Higher exchange inflows worth $35.01M were recorded in the AAVE token in the last seven days. Outflows of $33.95M followed this, and the token’s price correlation with Bitcoin was 0.49.
Technical Chart Analysis Of AAVE Token
AAVE has recently witnessed a significant 60% surge in its trading price. A breakout from a previous descending triangle pattern drove it. This upward momentum marks a crucial phase for AAVE, as a similar pattern has now emerged on the daily chart.
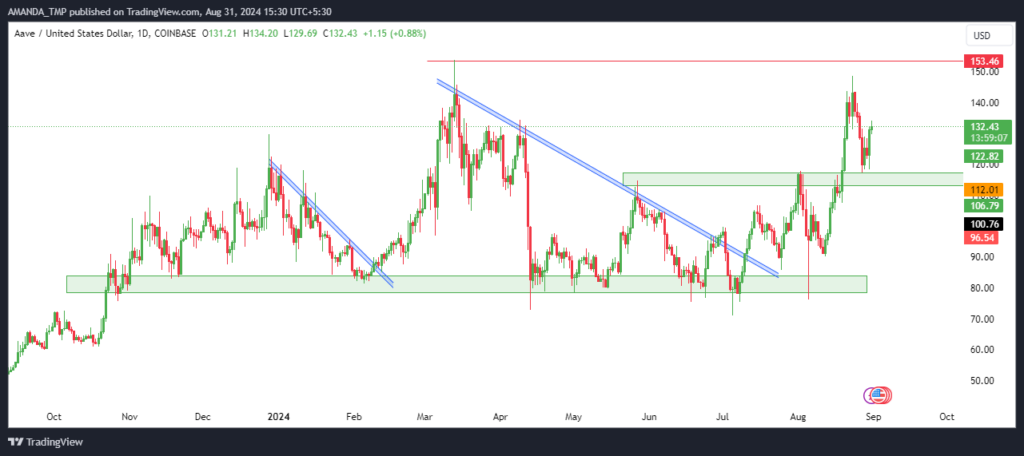
Over the past three days, the AAVE price has shown consistent gains, leading to a higher high swing on the chart. The token price further exhibited strong bullish behavior as the price broke out above crucial levels.
Where Are The Technical Indicators Of AAVE Token Heading Toward?
The 20, 50, and 200-day EMAs traded in a golden cross, followed by the price traded above the following EMAs. This showed a strong surge in the token’s price strength.
AAVE/USD Chart by TradingView.com
The MACD and the signal line have traded in the bullish trajectory, while the histograms on the chart were uncertain. Additionally, the following metrics traded in a bearish crossover, which might lead to a volatile scenario in the short term.
The RSI sustained above the 50-level and followed a bullish cycle as it recently hit the overbought zone. This exhibited strength in the token price.
The support levels for the AAVE crypto were $76.00 and $117.0. It was followed by the resistance levels of $153.0 and $200.0.
Disclaimer
This article is for informational purposes only and does not provide any financial, investment, or other advice. The author or any people mentioned in this article are not responsible for any financial loss that may occur from investing in or trading. Please do your research before making any financial decisions.




