
 Quack AI
 Lighter
 Pudgy Penguins
 Bittensor
 Solana
 Aptos
Aptos Quantus
- The BTC price traded in green for 13 days in the last 30 days.
- It outperformed Ethereum and 72% of the top 100 crypto assets in the last year.
The Bitcoin (BTC) price was stable, with a medium liquidity of 3.71%. The coin’s market cap dominance was 56.43%, making it the largest cryptocurrency in the world.
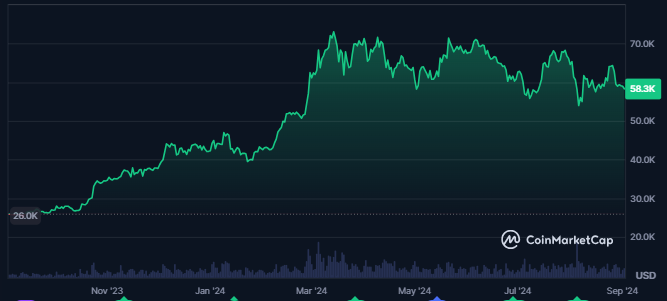
The Bitcoin price advanced by 125% in the last year and traded at a level of $58,147 at press time. Bitcoin’s market cap was $1.145 Trillion.
The value of the coin’s traded volume advanced by 75% in the previous 24 hours. It led to a traded value of $27.966B, showing huge liquidity in the coin and a fully diluted market cap of $1.217B.
Bitcoin’s supply inflation was very low at 1.40%, making it ideal for future price performance. The coin’s price sentiment was bearish, and the Fear and Greed Index was at 26, showing fear among investors.
A total of 54.179M holders at the time of writing were holding the BTC coin. Its top 10 holders held 5.61% of the total supply. Additionally, a surge in the number of holders could be seen over the last few weeks.
What Does the Derivatives Data Signify about the BTC Coin Price?
Longs worth $37.63M were liquidated in the Bitcoin price in the last 24 hours. Against that, shorts worth $8.33M were liquidated, showing sellers’ dominance in the price.
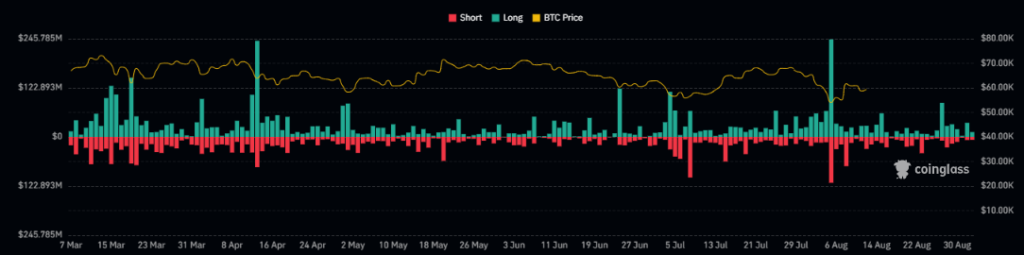
The Bitcoin derivatives data witnessed an advance of 80% in its traded volume within the last 24 hours. It resulted in a traded value of $49.96B, while the open interest witnessed a decline of 1.5%, showing a decline in the number of open positions.
Will BTC Coin Rebound From Its Current Support Levels?
Over the past five months, the Bitcoin price has been trading within a dynamic range, exhibiting a slight downward bias. This extended period of consolidation within a well-defined range has resulted in the formation of a falling wedge pattern on the daily chart.
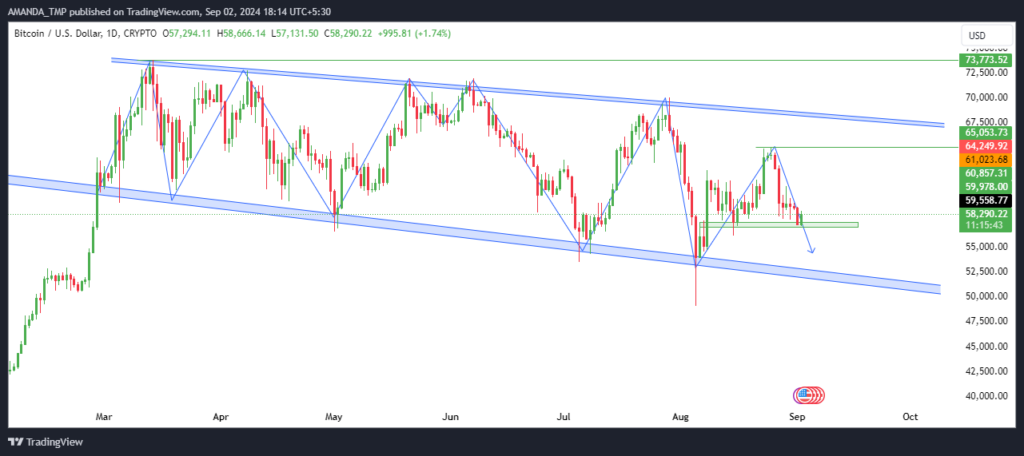
When writing, the Bitcoin price is positioned at a crucial support level, where it appears to be finding some stability. If it rebounds from this level and breaks above the most recent swing high, it could signal the start of a new upward surge.
However, despite this potential bullish outlook, the current candlestick formations on the chart indicate a dominant bearish sentiment. The strong bearish candlesticks suggest that sellers are still in control, casting uncertainty over the possibility of an immediate reversal.
Technical Indicators Still Indicate Bulls Glimpse In Bitcoin Price
Although the BTC price declined below the 50-day and the 200-day EMAs, these EMAs still traded in a golden crossover. It indicates the price might reverse from the lower levels and start rising.
BTC/USD Chart by TradingView
The MACD and the signal line traded in a bearish crossover and in a negative trajectory. It exhibited a strong downtrend in the token price.
The RSI also supported the declining behavior in the coin price as it declined below the 14-day SMA and the 50 level. It also followed a bearish cycle as it hit the oversold zone a few days ago.
The Bitcoin price might take support at the level of $49,000 and $50,000. Also, the resistance levels for the BTC price would be $65,000 and $73,700.
Disclaimer
This article is for informational purposes only and does not provide any financial, investment, or other advice. The author or any people mentioned in this article are not responsible for any financial loss that may occur from investing in or trading. Please do your research before making any financial decisions.




