
 Bitcoin
 ZKsync
 Pudgy Penguins
 Pearl
Pearl Quantus
 Starknet
 NEAR Protocol
- Despite the bearish outlook, some analysts remain optimistic about ATOM’s long-term prospects.
- ATOM’s price chart is forming a falling wedge pattern, which could signal a potential reversal.
The Cosmos (ATOM) price chart shows that the general trend of the currency is downward. Since the 2021 peak, it has dropped without a strong resurgence until now, over the broader chart.
The price has failed time and again to move past its previous major swing high points, instead falling majorly.
At the time of writing, from an all-time high of $44.800, ATOM was down over 90% and is currently approaching the nearest major support zone of $2.5.
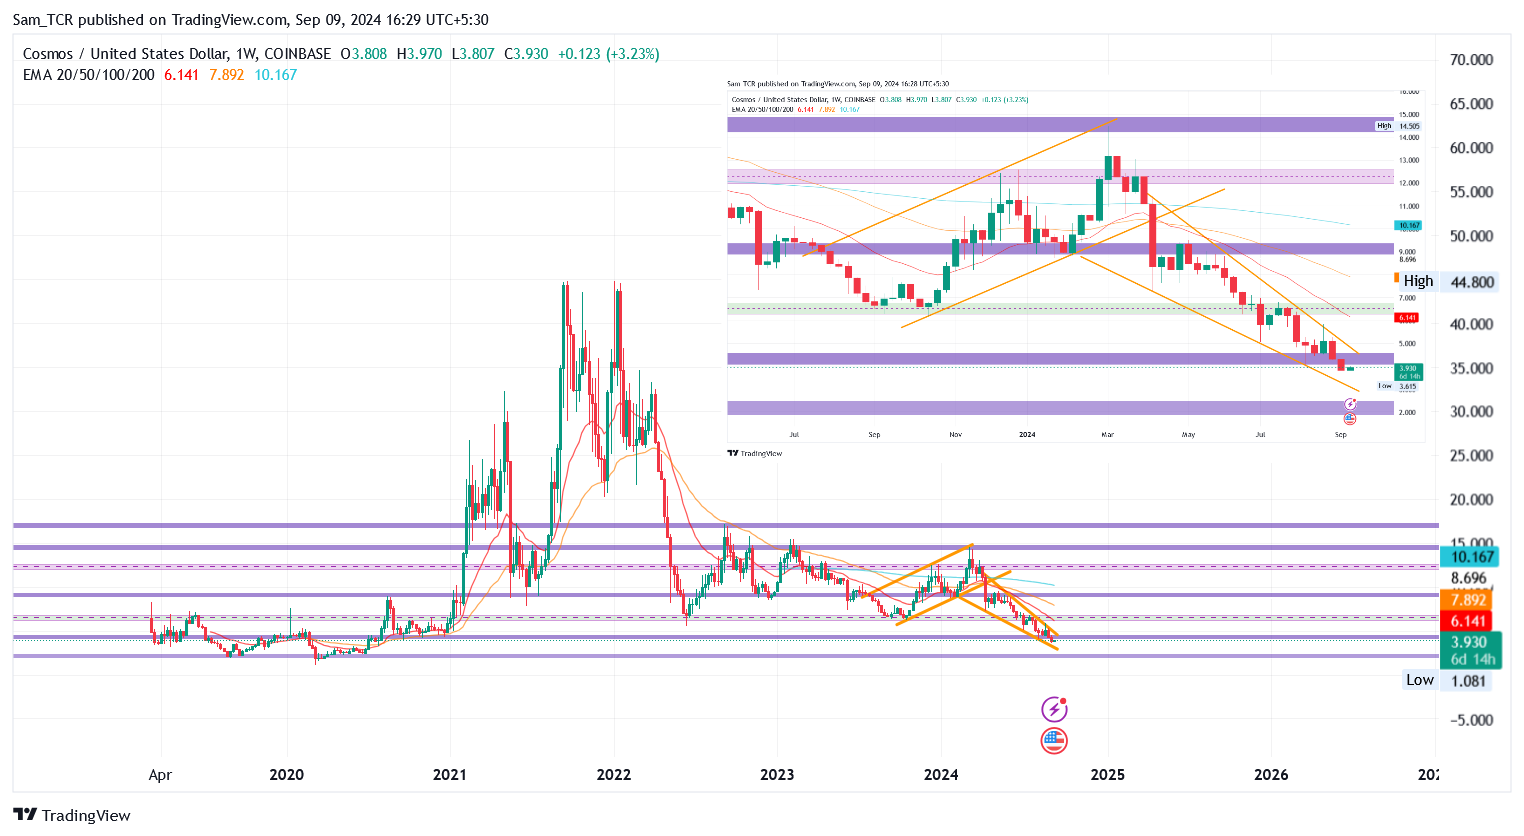
This support area is crucial, as the currency may witness a resurgence from it or a continued fall.
Therefore, waiting for the Cosmos price to reach support and confirm the resurgence via technical signals is much better.
Indicators Favor Bearish Angle in ATOM Price
At press time, the price gained 3.23% intraday, it last traded at $3.930. This asset comes in the class of top 50 assets globally, despite major sell-offs. Over the chart, the EMA bands (20, 50, and 200-day) remained dominant and pushed ATOM’s price below.
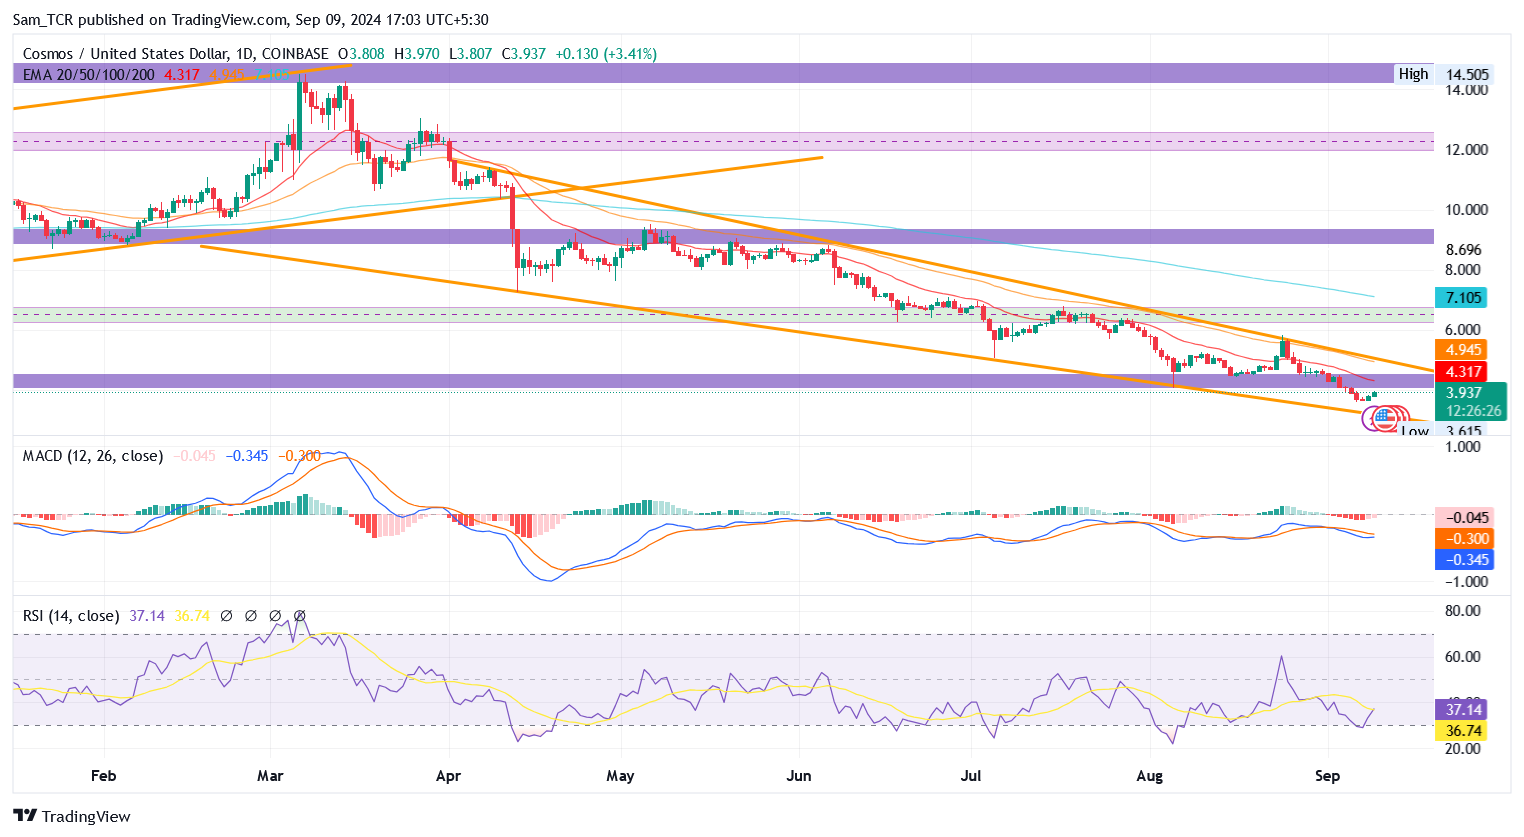
Similar to ATOM’s daily chart price, the indicator tools also depict a bearish trend. As RSI remained under 14-SMA, MACD showed a bear cross. This showed that bears still reigned supreme.
Is Analyst Bullish on Daily Chart of ATOM Price?
Despite the lack of lustrous movement in ATOM, many analysts are positive. One such analyst, @CryptoTony, eagerly awaits its price drop towards his buying level and accumulates this asset into his possession.
Since the fall from its ATH, the crypto ended up at its multi-year support of $6.5, which defended its price from bears time-over-time.
Correspondingly, from the last quarter of 2023 and the first quarter of 2024. ATOM price developed an ascending wedge pattern, after trying hard to rise.
However, the bearish downward pressure accelerated, which began from a YTD high of $14.505 achieved in the first quarter of 2024. This led to the failure of the long-sustained multi-year support of $6.5 in the third quarter of 2024. Similarly, the price has come down to the last month of the third quarter and showed no turning back signs.
based on the aligned analyst theory and ATOM’s daily chart, in the short term, the bearishness seems to continue toward the $2.5 support. This level seems pretty close to the analyst’s buying level.
ATOM experienced a sustained downtrend which, again, looked like a pattern under construction, precisely, a falling wedge pattern on the daily chart. If the support is followed by major bulls’ interest from the wedge’s lower boundary, ATOM price propulsion could break out with targets at $6 and $9, respectively.
However, on the continuation in the downside, the support mandate to be monitored would be the $2.5 demand zone.
Disclaimer
In this article, the views, and opinions stated by the author, or any people named are for informational purposes only, and they don’t establish the investment, financial, or any other advice. Trading or investing in cryptocurrency assets comes with a risk of financial loss.




