
 streamoors
 Sword Inu
 Altai the Tiger
 IGNITION
 no crying in the casino
 NEAR Protocol
 Pudgy Penguins
- The HBAR crypto price was highly volatile, resulting in a volatility of 6.03%.
- The annual inflation rate of Hedera crypto was extremely high.
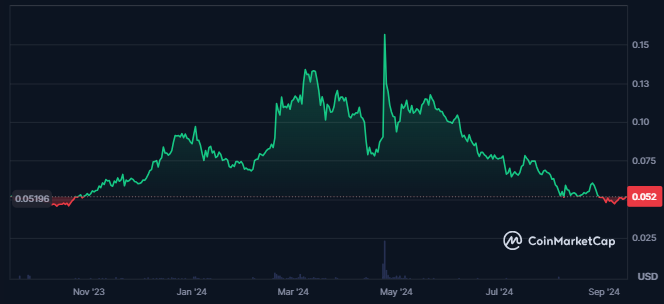
Hedera (HBAR) took a significant hit, attracting the eyes of traders for strong profit booking. As a result, the HBAR price plummeted by more than 70% decline in just five months.
With this downfall, the token traded at a substantial discount. This raised a question in every trader’s mind regarding the HBAR price prediction: What lies ahead for the token?
HBAR Price: Market Trends And Challenges
When writing, Hedera Crypto ranked the 41st largest cryptocurrency, with a market capitalization of $1.912 Billion. Despite this, the HBAR price movement remained sluggish. Over the past 24 hours, its traded volume declined by 8.6%, reflecting a dip in market activity.
The volume-to-market cap ratio stood at 1.33%. It indicated relatively low liquidity despite its significant market presence. Hedera’s market cap recorded a dominance of 0.09%.
Hedera Crypto‘s notable challenge was its high supply inflation, which stood at 141%. This indicated that the cryptocurrency would need to increase its value by over 141% to offset the inflationary pressure.
Despite this, investor sentiment remained neutral, with the Fear and Greed Index holding at 50. However, the broader sentiment around crypto has turned bearish.
Hedera’s total value locked (TVL) was approximately $49.05 Million. In contrast, its stablecoin market cap was recorded at $10.54 Million, adding further context to its market positioning.
Hedera Crypto Witnesses Decline In Trading Activity
Hedera crypto‘s derivatives volume saw a modest decline of 16% in the last 24 hours, bringing the traded value to $22.69 Million. This drop in volume coincided with a noticeable trend of long positions being liquidated. It indicated a period of seller dominance in the market.
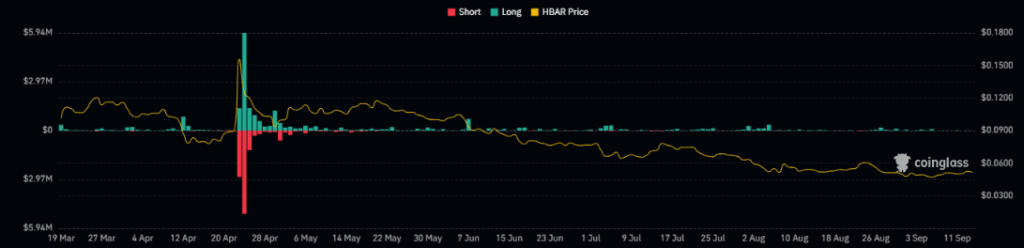
In the past few days, consistent long liquidations have been observed, further emphasizing the pressure from sellers.
In the last 24 hours, $7.96K worth of long positions were liquidated. In contrast, the much smaller short liquidations amounted to just $238.20. This sharp disparity underscored the challenging environment for buyers in the current market conditions.
HBAR Price Continues To Trade At Lower Levels
The HBAR price has been in a pronounced downtrend, marked by a series of lower highs and lower lows. From its recent swing high of $0.18420, HBAR experienced significant profit-taking. It triggered a steep decline of over 65%.
This persistent downward pressure has led the crypto to break below key support levels. It reinforced the bearish sentiment surrounding the asset.
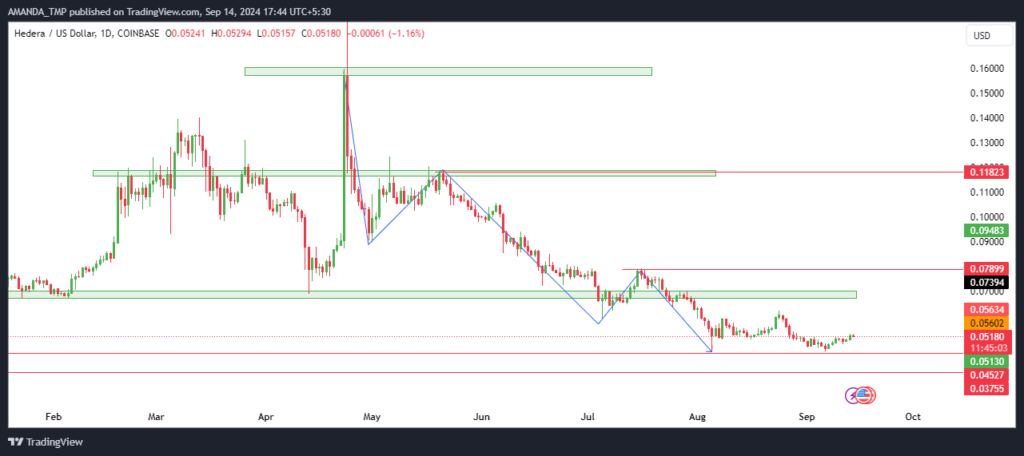
The ongoing price action suggested a lack of strong buying interest as the market favored sellers. Each attempt at recovery has met with renewed selling, preventing any meaningful rebound.
This price breakdown below crucial support levels further signals potential challenges for HBAR crypto. This happened as the trend shows no clear signs of reversal in the near term.
HBAR Token’s technical indicators slipped to lower levels
The HBAR price has fallen below the 50-day and 200-day exponential moving averages (EMAs), signaling a death cross. This pattern reflected a sustained downward trend in the crypto’s price, with further selling pressure likely to continue.
HBAR/USD Chart by TradingView.com
Technical indicators further reinforced the bearish outlook. The Moving Average Convergence Divergence (MACD) and the signal line moved negatively. On the other hand, bearish volume bars are visible on the chart, supporting the downward momentum.
The RSI has also declined into oversold territory relative to the 14-day SMA. This indicated a loss of bullish momentum and the potential continuation of a bearish cycle.
Despite some uptick in derivatives trading, overall market sentiment remains negative. The HBAR price may find potential support at the $0.0450 and $0.0570 levels.
Conversely, the resistance is expected around $0.030 and $0.040. These key levels will be crucial to monitor as the asset navigates this challenging period.
Disclaimer
This article is for informational purposes only and does not provide any financial, investment, or other advice. The author or any people mentioned in this article are not responsible for any financial loss that may occur from investing in or trading. Please do your research before making any financial decisions.




