Quantus
 Injective
 NEAR Protocol
 Sei
Sei Derive
 Bitcoin
 Zcash
Zcash
- The ZEC price escaped the horizontal neckline of $30, targeting the $50 mark next.
- Zcash crypto saw an upswing of over 50% in the past two weeks.
Zcash (ZEC) price has recently witnessed an impressive rally, driven by a significant volume surge. The ZEC price crossed the crucial horizontal neckline hurdle of $30 last week and cleared the path toward the $50 mark.
As bullish enthusiasm builds, the altcoin displays a minor profit booking and retests the $35 level for a sustained upmove ahead. Can it successfully chase the $50 target? Keep on reading to learn about ZEC’s true potential in the upcoming months.
Zcash Price Prediction: Can It Rally Toward the $50 Target?
The ZEC price has climbed above the key moving averages in the daily time frame and regained bullish momentum. The surge in market confidence is helping to support the upward movement of ZEC crypto.
The rise in buying interest and positive sentiment were evident on the chart. This week, altcoin gained over 30% alongside a 52% rise in trading volume, which displays investor interest.
The ZEC token was trading at $35.52 at press time. It was retraced over 7% during the intraday session. With a market cap of $576 Million, ZEC was ranked as the 116th largest crypto.
In a recent tweet, Crypto Analyst, WorldOfCharts, said that the ZEC price was testing a crucial trendline hurdle of the multi-year descending channel.
In case of a successful breakthrough, a massive upward rally could be possible in the following sessions.
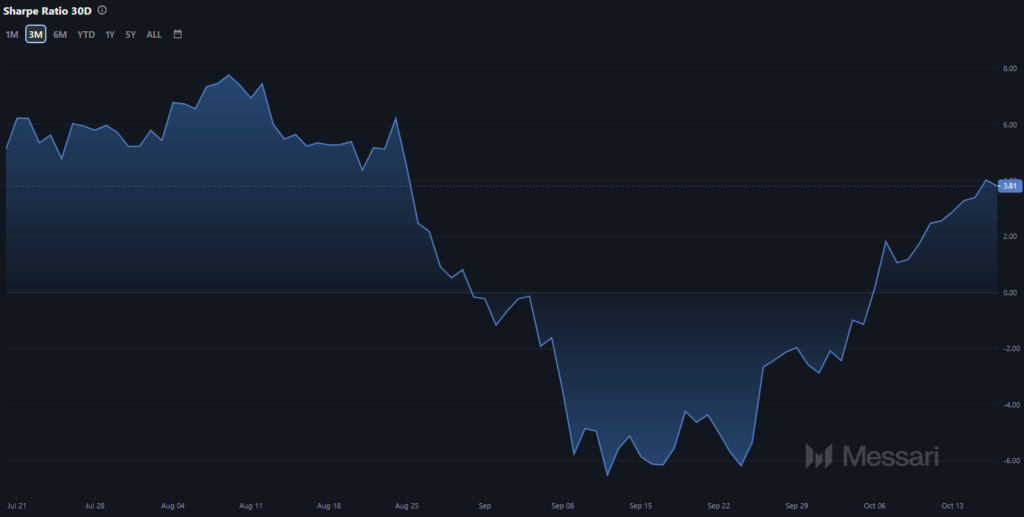
The rising Sharpe Ratio suggests that Zcash may be the best bet at the moment. That’s because the current sentiment favors the rise and could lead to further price surges. The altcoin’s Sharpe Ratio was noted at 3.81 at press time.
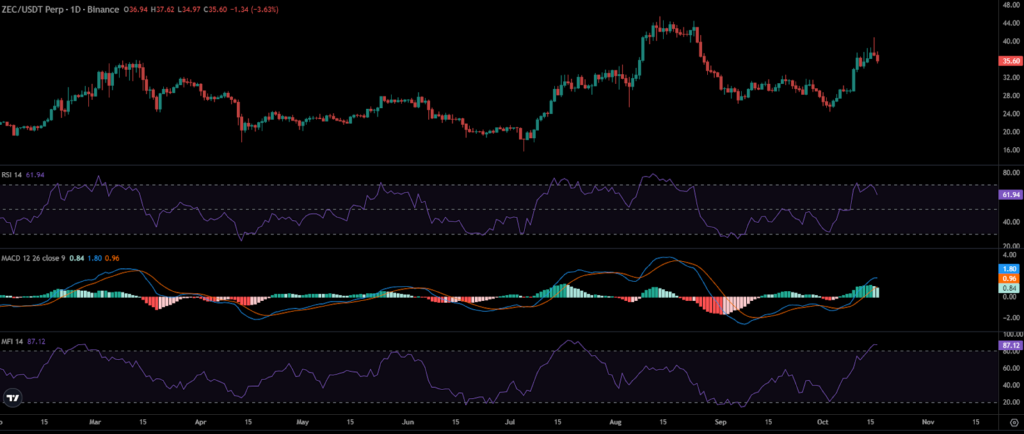
The Relative Strength Index (RSI) curve soared to the overbought zone, staying around 60 at press time. It represents the positive market interest surrounding ZEC.
Likewise, the MACD indicator plotted green histogram readings, reflecting the bullish cues. Furthermore, the Money Flow Index (MFI) reading was above the midline, around 87 at press time.
Typically, values above the 50 mark represent strong inflows in the market. The price action indicates the positive market sentiment and a fresh buyer accumulation activity in the past two weeks.
A golden crossover between the 50-day and 100-day EMAs was observed, which conveyed bullish cues. Per the Fib levels, the ZEC price has crossed the 50% level and targets the 61.8% mark to catch ahead.
After a long time, the ZEC price has crossed the significant moving averages, which guides a fresh trend reversal. A daily close above the $38 mark would trigger further buying momentum and could lead to the $50 mark.
Futures Market Data Suggest Bullish Optimism
Traders are optimistic about ZEC’s price rally, as the OI-weighted funding rate remained positive throughout the week. The funding rate was noted at 0.0111% at the time of writing.
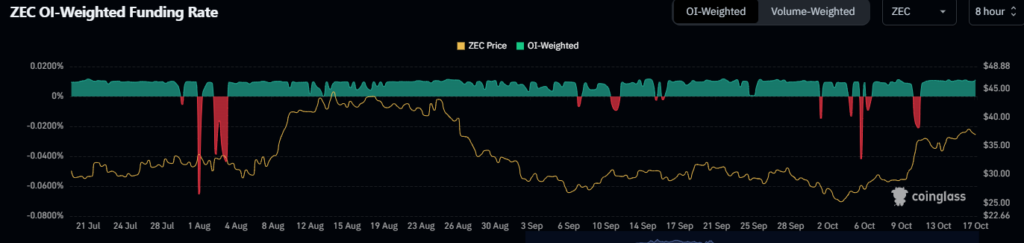
However, the Open Interest (OI) has dropped over 12.20% to $18.33 Million. That represents a minor long unwinding move over the past 24 hours.
The immediate support zones for the ZEC price were $32 and $30, whereas the upside hurdles were $38 and $40 to watch out for the following sessions.
Disclaimer
The views and opinions stated by the author or any people named in this article are for informational purposes only. They do not establish financial, investment, or any other advice. Investing in or trading crypto or stock comes with a risk of financial loss.