Pearl
Pearl NEAR Protocol
 Bitway
 Starknet
 Walrus
 Pudgy Penguins
 Hyperliquid
- Analysts believe the Render token may hit about $50-$80 in the present cycle.
- Whales have been acquiring over 20.5 million RNDR in the recent past.
- Increasing adoption of decentralized computing enhances Render’s prospects.
Render (RENDER) price has been consolidating close to the trendline support of the symmetrical triangle pattern. It was hovering around the 50-day EMA support and hoping for a bounce.
Throughout the week, the RENDER token price remained sideways, replicating indecision between bulls and bears. However, the fundamentals and technical indicators suggest the token may see a change in the market dynamics in the short term.
What Are Analysts Predicting for Render’s Future Potential?
Along with the recent developments, various crypto analysts predict RENDER’s future via tweets. Crypto Analyst Mr. Patrick Schmitt highlighted his bullish sentiment for Render. He pointed out that the RENDER token may rise to $50-$80 in the short term.
He added that the token could surge 10-15x in terms of liquidity and relation in the industry. Notably, the Render price was retraced over 61% from its March 2024 high of $13.60.
Another Analyst, MACHINE 4 LPHA, said, “RNDR can easily reach a $100 Billion market cap this cycle as money pours into AI.”
The RENDER token has formed an ascending triangle pattern in his chart. A successful breakthrough above the horizontal neckline of $7 would push the token toward the ATH trajectory.
The RENDER price was trading at $5.31, replicating flat movement. Over the past 24 hours, the altcoin moved only by -0.14%, representing a lack of volume participation. It boasted a market cap of $2.75 Billion and has a volume-to-market cap ratio of 0.0643.
What Do Technical Indicators and On-Chain Data Say?
The recent on-chain transactions around Render have been very active due to real use-case in rendering. Token burns have risen to more than double what they were in mid-August. This is because of the growing usage of 3D artists and studios.
The Render token’s ecosystem is steadily growing. The process of creating virtual content and the demand for decentralized rendering power have increased.
However, the charts depicted that whales and sharks have bought more than 20.5M RNDR tokens. It was equivalent to $126.3M in merely 11 weeks. This made up 91% of the total RNDR supply.
This large sum of money suggested that large shareholders think there’s long-term potential in Render and its AI-token systems. The On-Balance Volume (OBV) depicted neutral readings, around 16.47 Million. It represented flat movements.
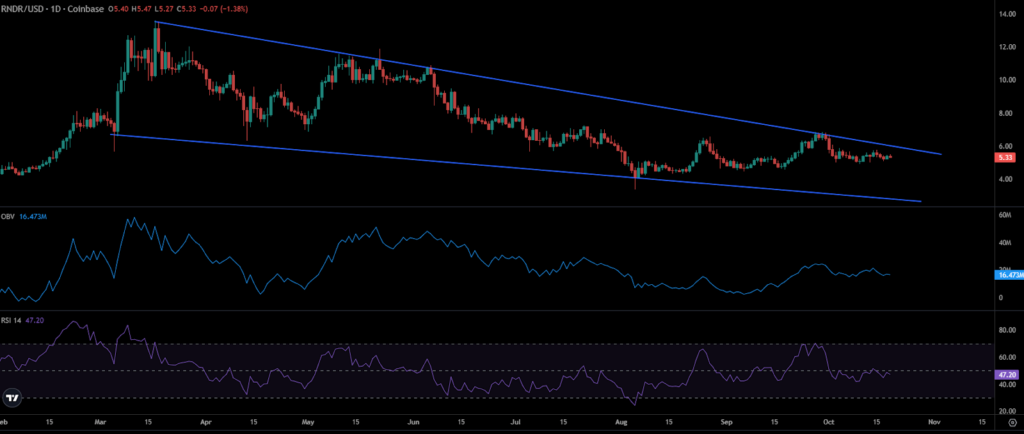
However, the Relative Strength Index (RSI) line rebounded to the midline region, 47 at press time, signaling mixed cues.
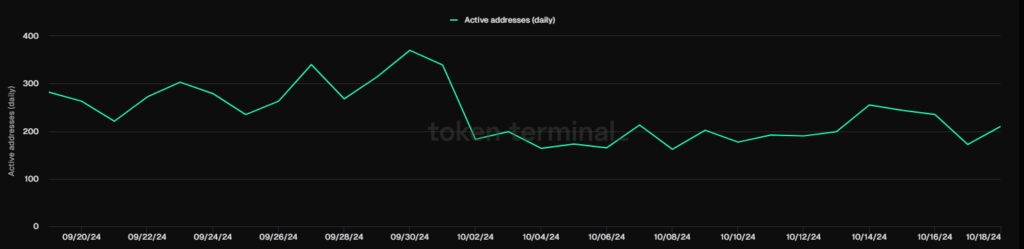
Looking at the daily active addresses data, it replicated a rise this week. This significant surge means new addresses have gained interest in the token, which might fuel the network growth.
Amidst the choppy price action, the OI-weighted funding rates stayed positive for the past two weeks.
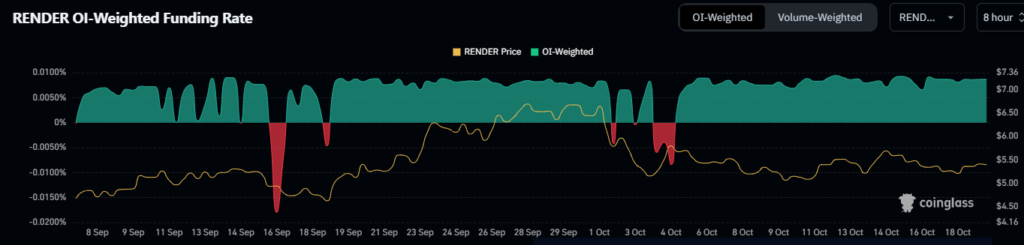
At press time, the funding rate was around 0.0087%, implying sustained demand for the long positions. The immediate support levels for the RENDER token were $5 and $4.30. At the same time, the resistance levels were $6.20 and $7.
Disclaimer
In this article, the views, and opinions stated by the author, or any people named are for informational purposes only, and they don’t establish the investment, financial, or any other advice. Trading or investing in cryptocurrency assets comes with a risk of financial loss.