Zerebro
 Bitcoin
 Aerodrome Finance
 ZKsync
 Pearl
Pearl Pudgy Penguins
 Bitway
- MOG coin displayed bullish momentum after the US election.
- The memecoin surged over 8% intraday and was poised for a breakout.
MOG coin price has displayed significant outperformance in light of the US elections this week. It has registered an upsurge of over 35% and was edging closer to a breakout.
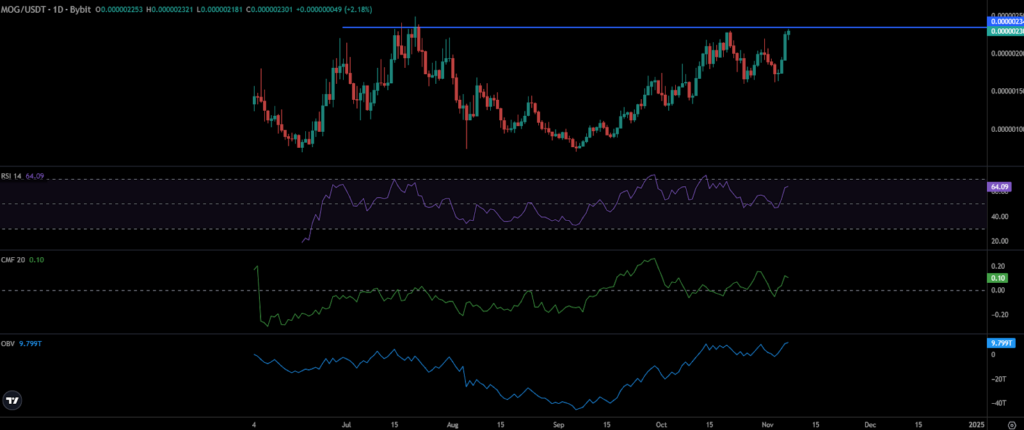
The token has formed a cup and handle pattern, which is often considered a bullish pattern. The horizontal neckline was placed around $0.0000002350, acting as a resistance zone. It traded above the key moving averages and witnessed significant demand over the past few sessions.
The growing speculation among the market participants fueled the bullish upsurge. MOG crypto’s current price was 8.75%, which is far from its ATH mark of $0.0000002445.
MOG Price Prediction: New ATH Imminent?
MOG price prediction depicted a bullish chart structure. The token has approached the key resistance area of $0.0000002300. It is poised for a breakout to reach the ATH trajectory.
Since last month, the memecoin has been trading under the bullish bias and persists in delivering outperformance. In the previous 45 days, the memecoin has surged over 65%.
In a recent tweet, Planfomo said the MOG crypto was edging closer to registering a potential breakout. The breakout formed an ascending triangle pattern. It could surge significantly above the hurdle of $0.0000002430 in the coming sessions.
$MOG (1000000MOG) appears to have a high probability of breaking through this potential ascending triangle pattern. It’s facing significant resistance, but we could see strong momentum after a breakout and retest around $2.4320. pic.twitter.com/NMEc8ZDT7B
— Planfomo (@planfomo) November 6, 2024
Likewise, NFTWizart, in his tweet, highlighted that MOG crypto had formed a cup and handle pattern. That might trigger a massive upsurge shortly.
Per the Fibonacci retracement levels, the MOG coin price stayed above 61.8%. It has rested at the top of the upper Bollinger band.
MOG coin was trading at $0.0000002309 at press time. The price was up over 11.20% intraday. It ranked 78th among the top crypto coins. The trading volume rose 23%. Also, the market cap surged to $901.25 Million over the past 24 hours.
MOG Coin Technical Analysis
The daily timeframe analysis of the MOG coin displayed that a breakout was on the horizon. The Relative Strength Index (RSI) curve highlighted bullish momentum. It stayed in the overbought zone 64 at press time.
The Chaikin Money Flow Index (CMF) indicated a bullish outlook; the positive reading conveyed a liquidity surge in the market. Additionally, the rising On-Balance Volume (OBV) represents buyer accumulation.
The bullish trend was intact, and higher high formation was noted. A daily close above $0.0000002350 would permit the bulls to reach the ATH mark ahead.
The buyers have maintained their upper hand and gained traction. If the MOG price faces rejection from $0.000002350 levels, it may return to $0.0000002200 shortly.
The Futures Market data revealed significant demand for long contracts. This happened as the OI-weighted funding rate stayed positive at around 0.0521%.
Also, the Open Interest (OI) surged over 3.20% to $690.6k. That represented long buildup activity over the past 24 hours.
The immediate support zones for the MOG coin price were $0.0000002200 and $0.0000002100. On the other hand, the resistance levels were $0.0000002390 and $0.0000002450.
Disclaimer
In this article, the views, and opinions stated by the author, or any people named are for informational purposes only, and they don’t establish the investment, financial, or any other advice. Trading or investing in cryptocurrency assets comes with a risk of financial loss.