
 Sword Inu
 streamoors
 Altai the Tiger
 no crying in the casino
 IGNITION
 Pudgy Penguins
 Quantus
- Ripple price has engulfed the previous day’s candlestick, demonstrating buyers’ grip.
- The XRP price has increased by 42% in the past 10 days.
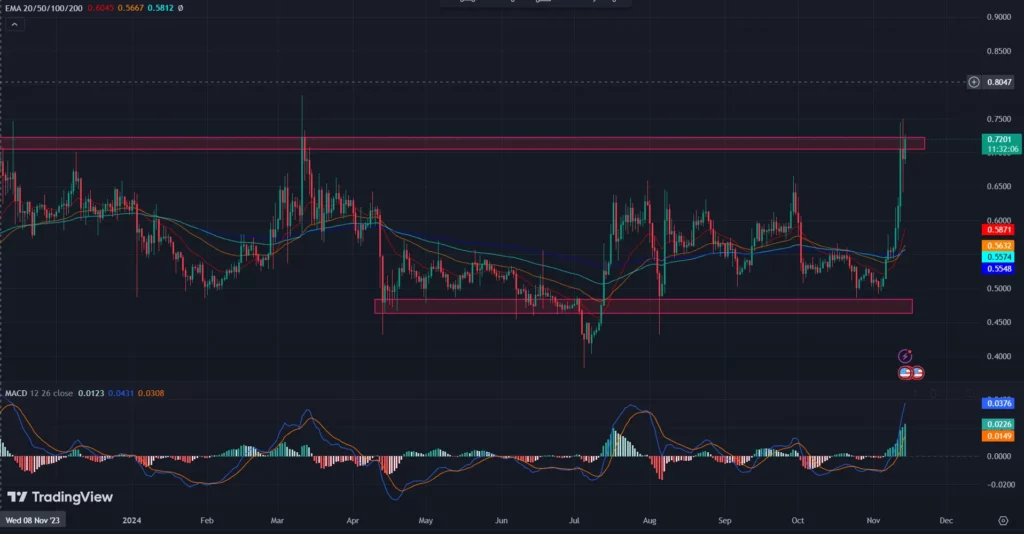
Ripple’s (XRP) price has reached the significant resistance territory of $0.700. The token is still generating buying signals.
The XRP price looked highly bullish on a weekly time frame and surpassed the primary resistance zone of $0.650. This major breakout from the $0.650 level could trigger massive buying pressure.
The technical chart has witnessed a bullish outlook in a broader time frame. It can lift the price to $2 in the next few months.
There has undoubtedly been a dynamic increase in the XRP crypto price over the last two weeks. The price rose from roughly $0.5 on November 1 to approximately $0.6 on November 10.
XRP Technical Analysis: Could It Make It to the $2 Mark?
At press time, the XRP price was trading at $0.710 with an intraday gain of 3.31%. It has a market value of $40.59 Billion and ranked 7th in the cryptocurrency market. The 24-hour trading volume was $6.34 Billion.
The chart structure displayed that Ripple dominated the resistance zone, and another upside rally can be seen. If the price surpasses the $0.800 mark with strong buying momentum, it could hit the $1 mark in the next few days.
The current market sentiment is bullish, and Bitcoin is at an all-time high. Bitcoin is a leading coin and has had a significant impact on altcoins. BTC’s chart structure indicates a bullish forecast, which may positively affect the XRP price.
On the other hand, if the digital asset price fails to hold the $0.700 territory, it could generate a selling signal. Profit booking could be anticipated once the price starts trading below the $0.650 mark. Profit booking at this level could trigger a bearish trend for the next few weeks.
The XRP crypto price has smashed the key moving averages based on the technical indicators. That showcased a bullish forecast.
The MACD and the Signal lines have rapidly traveled over the Zero line, demonstrating the buyers’ dominance. The histograms have formed green histograms, indicating the buyers’ grip.
A Resistance Zone of $0.700 is supported by XRP Liquidity Levels of $0.630
Given that the XRP price traded at $0.692, the liquidation map showed the leverage limits for long and short positions.
There is a possibility that the token price level may drop below $0.630 at that specific moment. If this happens, a reversal in the price will result in forced sales and eliminate the weak liquidity.
This outcome was indicated by the long liquidations forming clusters on the left side of the chart. It is a crucial support area because many longs have stop losses in this range.
XRP Price Analysis and Forecast
XRP price has a strong bullish trend following its breakout above the critical resistance levels of $0.650 and $0.700. It has faced a significant increase of 42% over the past ten days and has the potential to reach the $2 mark in the coming months.
The momentum seems to be in favor of buyers. The current market sentiment, bolstered by Bitcoin’s all-time highs, has also contributed positively to XRP’s outlook.
However, it’s essential to monitor the price closely. A drop below $0.650 could signal profit-taking and initiate a bearish trend in the short term.
If the buying momentum continues and XRP crypto clears the $0.800 mark, it may soon test the $1 level. This could maintain the bullish outlook.
Disclaimer
In this article, the views, and opinions stated by the author, or any people named are for informational purposes only, and they don’t establish the investment, financial, or any other advice. Trading or investing in cryptocurrency assets comes with a risk of financial loss.




