
 astronaut
 Pearl
Pearl Hyperliquid
 Walrus
 Pudgy Penguins
 Bitcoin
 NEAR Protocol
- Render price has escalated by 113% since November.
- Analysis indicates that Render is on its way to the $31 target after breaking the weekly trendline.
- The drawdown in the RENDER percentage from ATH is currently 21%.
Since November, Render (RENDER) price has been in a bullish trend and has advanced by 113% till date. Amid this bullish trend, the price has reached a previous resistance zone. In this resistance zone, the Render crypto price has shown weakness.
Notably, the momentum slowed down in the last two weeks of November. However, the price has witnessed a massive bullish spike and has reached a resistance zone of $11. Its performance in the resistance zone will be closely monitored.
RNDR price was held below a resistance level at roughly $6.50, which corresponded with the descending trendline, between October 2023 and April 2024. The legitimacy of the breakout was confirmed when this line was breached on a significant volume.
The price has risen significantly since breaking this line, surpassing multiple small resistance levels without retracing, indicating strong buying pressure.
Reduced Drawdown From its ATH by RENDER
The decline from the all-time high (ATH) of the RENDER (RNDR) token, which is currently only 21.10%, shows a notable recovery. This graph shows the price of RENDER over multiple years, along with its departure from the all-time high.
In the beginning, RNDR experienced sharp declines, with drawdowns reaching as low as -90%, signifying significant market downturns.
However, RENDER has recovered significantly in the last 12 months. With the price line getting closer to the zero drawdown mark and indicating a smaller gap from its ATH, the price trajectory on the chart exhibits a steady upward movement. This improvement points to a recovery in investor confidence and RENDER’s market value.
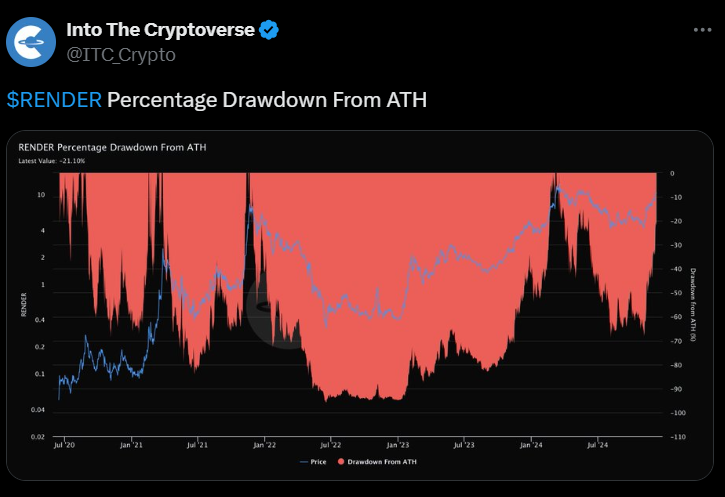
A pivotal aspect is the most recent spike in price, corresponding with the substantial decrease in the drawdown percentage. Such a recovery phase may indicate greater use or adoption of the RENDER network and is frequently indicative of favorable changes within the project’s ecosystem or wider market acceptance.
As the price rises, the blue price line and the red drawdown area above it converge, showing how near RENDER has come to re-entering its highest price point in history.
Investors searching for assets that have recovered well from prior lows will view RENDER favorably because of this visual analysis, which highlights a strong rebound.
Render Network Boosts Solana Popup
The venue and cutting-edge technical foundation were supplied by Render Network. It used a global network of GPUs to render the event and its digital content.
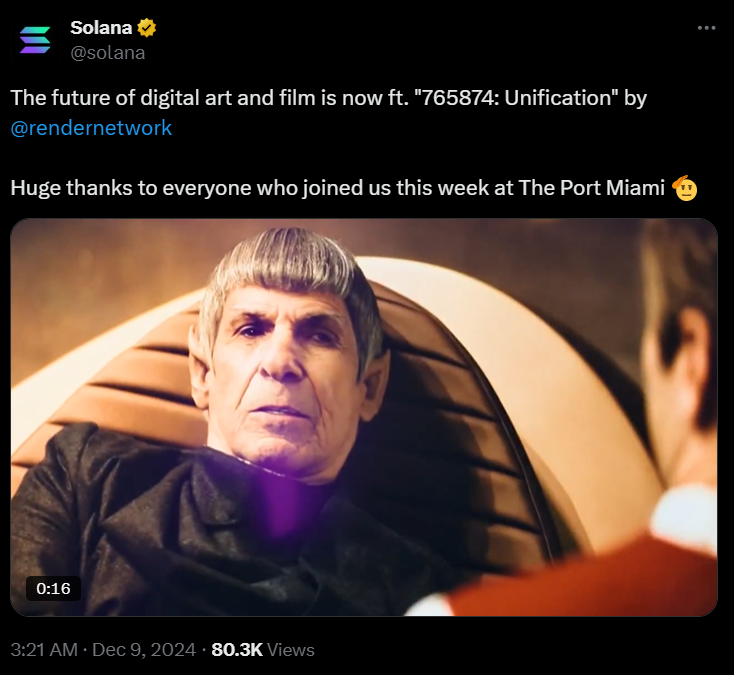
This configuration demonstrated how decentralized procedures could be seamlessly integrated with Solana‘s high-performance blockchain. This would guarantee a stable platform for online meetings.
The partnership demonstrated Render’s expanding clout in the blockchain community and its ability to advance the frontiers of content delivery and decentralized computing.
The new content has received millions of views. It highlights the usefulness of blockchain technology in digital communication and content distribution outside finance.
One of the greatest success stories of how decentralized platforms can become widely used, this event paid tribute to a cultural icon. Moreover, it showed how blockchain technology can transform entire industries.
Disclaimer
This article is for informational purposes only and provides no financial, investment, or other advice. The author or any people mentioned in this article are not responsible for any financial loss that may occur from investing in or trading. Please do your research before making any financial decisions.




