
 Quack AI
 NEAR Protocol
 Pudgy Penguins
 Pearl
Pearl Quant
Quant Quantus
 Sui
Sui- LINK price has witnessed a breakout and could move toward $30 soon.
- It has completed the 2nd correction wave and is poised for the 3rd rising wave.
- The token has recorded a cup and handle pattern over one week.
Chainlink’s (LINK) price has breached the trendline barrier of the descending triangle pattern. Following this, it primed for a bullish reversal. An upward movement may occur if the Chainlink price rises above the $22 resistance barrier.
The LINK price has also exhibited a cup and handle pattern breakout on a weekly basis. This positioned the token for an upcoming push toward $30.
It has breached a consolidation phase and completed the retracement phase. At press time, the Chainlink price traded at $22.12, noting an intraday decline of over 0.60%. Its market cap stood at $14.10 Billion, ranking 13th among the top crypto coins.
Chainlink witnessed Cup and Handle Pattern Breakout
The Chainlink price has traded upward through a large cup and handle formation. With this, it crossed the $18 level and retested before a further upswing.
Per the Elliott wave theory, the LINK token moved toward the 1st wave in early 2024. Moreover, it has completed the correction phase in the past few months.
Recently, it turned back and breached the pattern’s neckline and showed significant bullish movement. Currently, the LINK token moved above $20, with the target set to hit ATH by the first quarter of 2025.
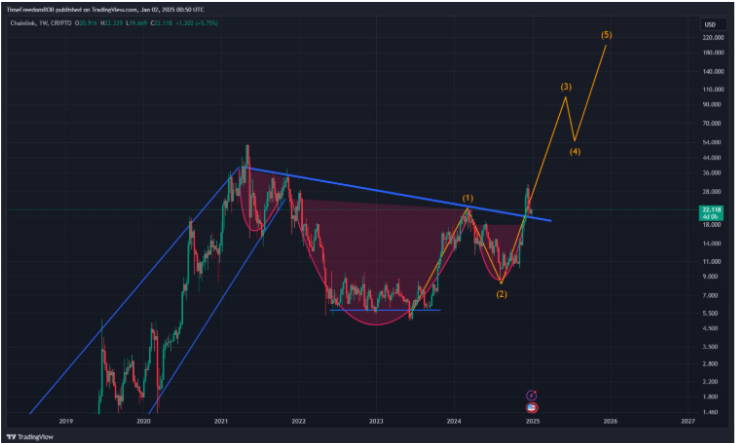
The downward trendline violation for multi-year resistance resulted in a decisive breakout. That suggested a long-term bullish move.
According to Elliott Wave analysis, there was likely a five-wave structure. Wave 1 tested close to $35 before pushing to $11 during Wave 2 correction. Wave 3 may surpass $100.
The handle retest further acted in favor of the bulls. If maintained over time, the LINK would hit other major price milestones, including an ATH in early 2025.
Chainlink Price Could Surpass $30 Soon: Analyst Weigh In
In a recent post on X, Analyst World of Charts pointed out that the Chainlink price has completed the correction phase. Furthermore, it was ready to explode in the following sessions.
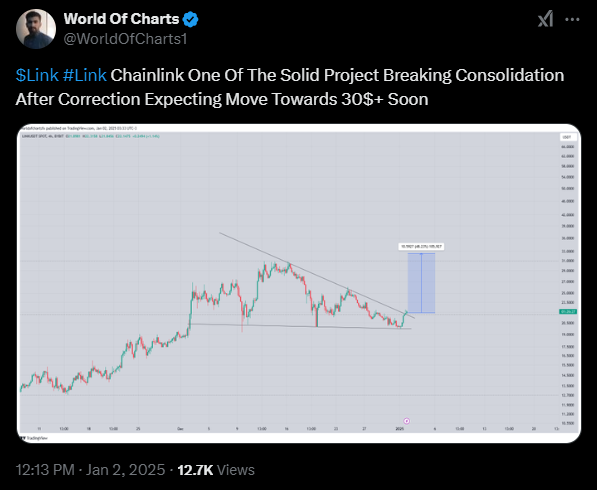
The token has breached the trendline of the descending triangle pattern. Also, it could visit the upside mark of $30 in the coming days.
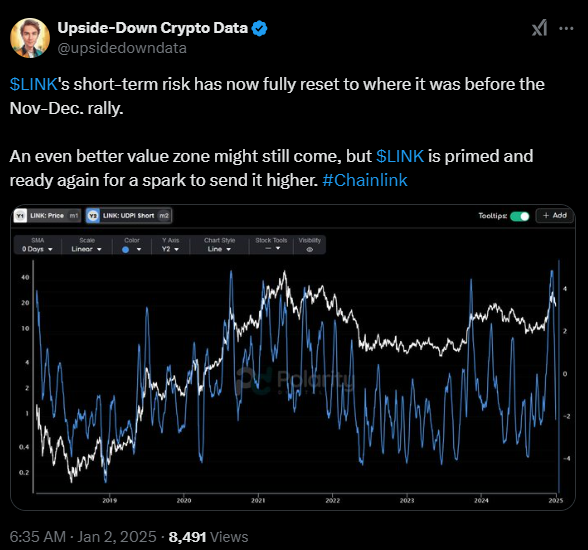
Following the November-December rise, there is a short-term chance that the LINK price will completely reset. It has returned to levels last observed before the price hike.
This chart depicted that the market was relatively unstable from 2021 to 2022. There, the blue line curve shows fluctuation in short-term risk. The short-term risk declined significantly by the end of the year 2024. That indicated lower speculative activities and a new market state.
The token’s value zone has remained attractive. However, further moves could improve accumulation opportunities for long-term holders.
Chainlink Price Analysis: Key Levels to Watch Out
Daily time frame analysis shows that the Chainlink price has corrected more than 6% in the past seven days. The token has reached the 50-day EMA support mark. However, the Bulls have defended the zone and saw a noteworthy rebound.
It has overcome the trendline barrier and finished the correction phase. The chart layout features a cup and handle theme. This transmitted a bullish thesis.
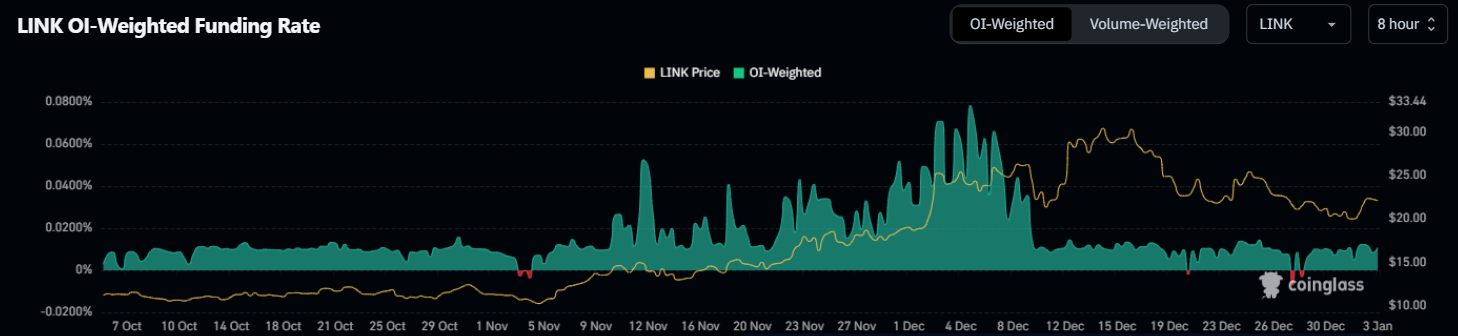
Going forward, the OI-weighted funding rate remained positive at 0.0107%. It signaled steady demand for long contracts. The immediate support zones for the Chainlink price were $18 and $15. On the other hand, the upside hurdles were $25 and $28.
Disclaimer
This article is for informational purposes only and provides no financial, investment, or other advice. The author or any people mentioned in this article are not responsible for any financial loss that may occur from investing in or trading. Please do your research before making any financial decisions.




