
 Dacity Coin
 Pearl
Pearl Bitcoin
 Injective
 Pudgy Penguins
 Quantus
 Starknet
- Ethereum formed an inverted head and shoulders pattern and is primed for a rally.
- Analysts project a move to $4,755 as the mid-term target.
Ethereum price is ready for a significant price rally as it replicates an inverted head and shoulders pattern. Over the past few days, Ethereum price has been consolidating in a tight range and breached the $3500 neckline hurdle. Despite the breakout, bulls failed to make follow-on gains and Ethereum price reentered the congestion zone.
At press time, Ethereum price was trading at $3320, noting a significant decline of over 9.23%, reflecting intense profit booking in the past 24 hours. Its market cap had fallen to $400.87 Billion.
However, if ETH price breaks through the critical resistance of $4000, it could hit $4755 soon. Read on to find out how.
Ethereum Price Poised for $4755 Amid Bullish Chart Pattern
According to BATMAN, a crypto analyst, Ethereum crypto has formed an inverted head and shoulders pattern on the 3-Day timeframe.
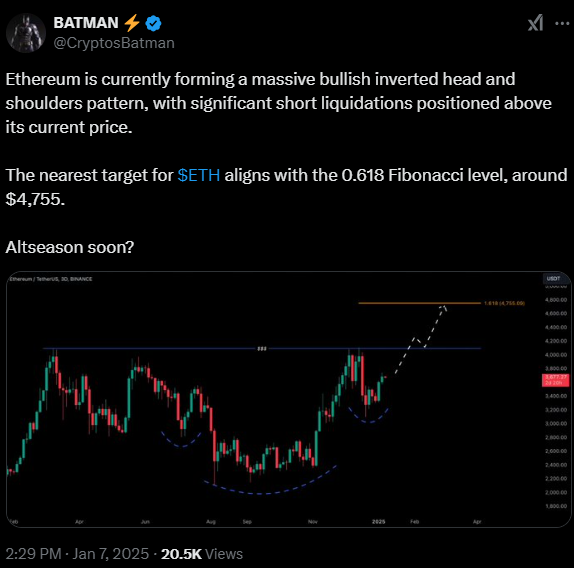
If Ethereum price successfully breaches and closes above the $4000 neckline hurdle, it could rally by 25% to $4200. Likewise, if this level is breached, ETH price could gain another 5%, potentially reaching $4755 in the coming days.
Notably, Ethereum price has bottomed out near $3100 level and it replicates a higher low formation. Once it completes it, it could mark a fresh higher high above $4000 soon.
Ethereum’s Technical Analysis and Key Levels
An analysis of the daily timeframe shows that Ethereum has been stagnating around the $3400 level and is floating sideways. Recently, the bull army tried to exit the zone, but a fakeout was observed and it re-entered the cage.
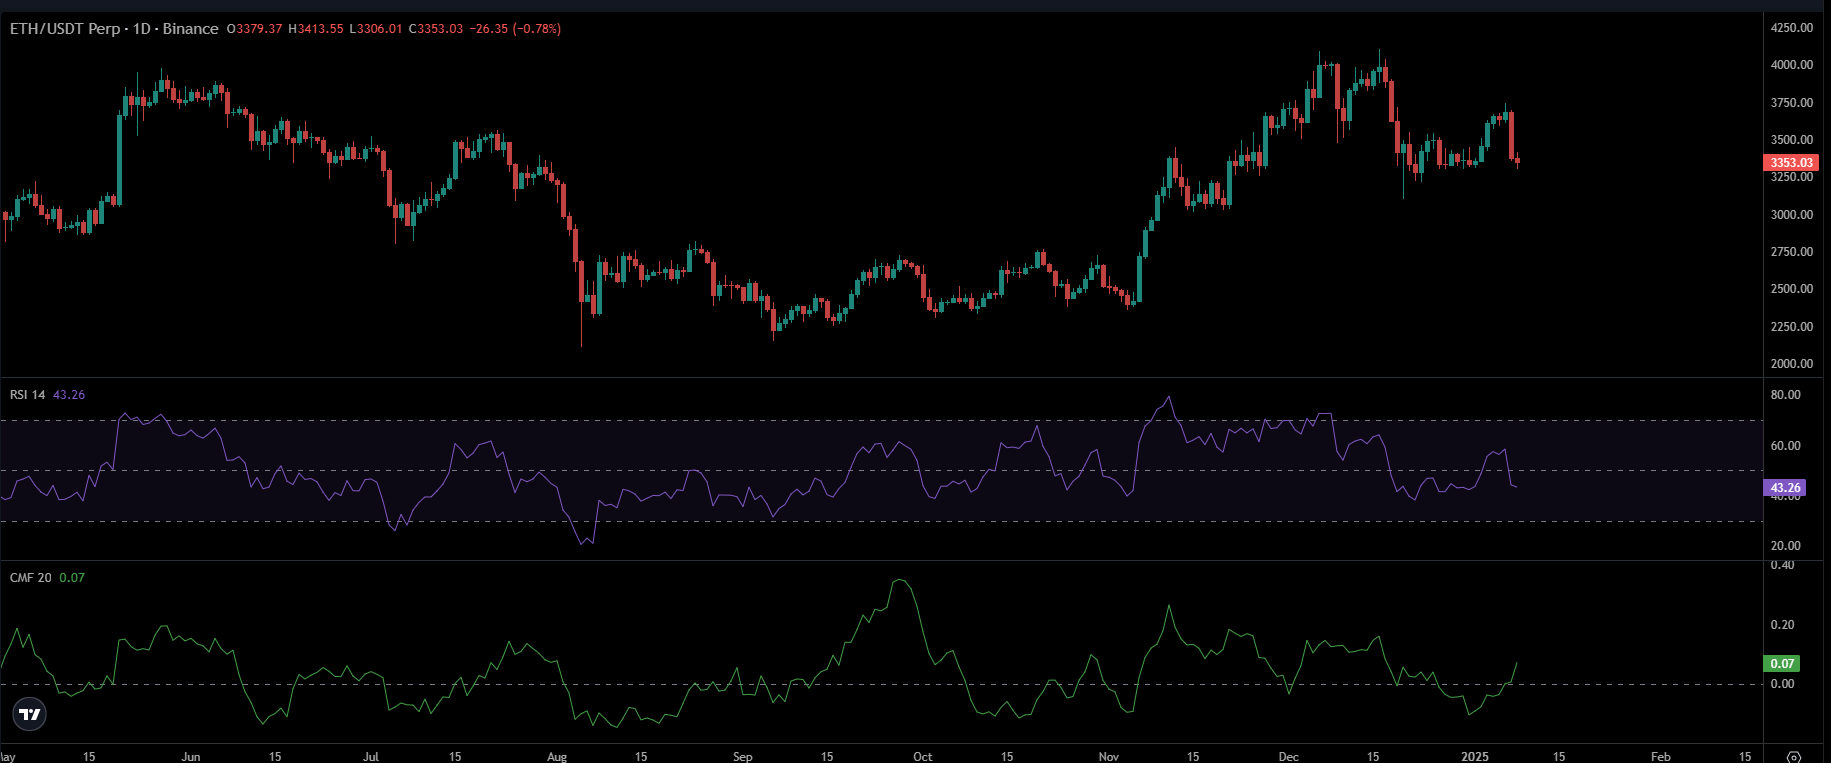
However, the Relative Strength Index (RSI) line had a reading below the midline and is headed toward the oversold region at 43. It signals a lack of buying momentum and represents a slightly bearish outlook.
On the other hand, the Chaikin Money Flow (CMF) line surged to 0.07, implying increased capital inflows in the market.
The Bollinger band indicates increased volatility, with ETH trading below the middle band. It has slipped below the 20 day and 50 day EMAs and could retest the 100 day EMA mark if the selloff extends.
Ethereum’s On-Chain Metrics Outlook
According to Global In/Out of the money indicator data from IntotheBlock, 72% of in-the-money holders were profitable at press time. Also, Ethereum price was trading around the on-chain support zone of $3200, where holders purchased 7.30 million ETH.
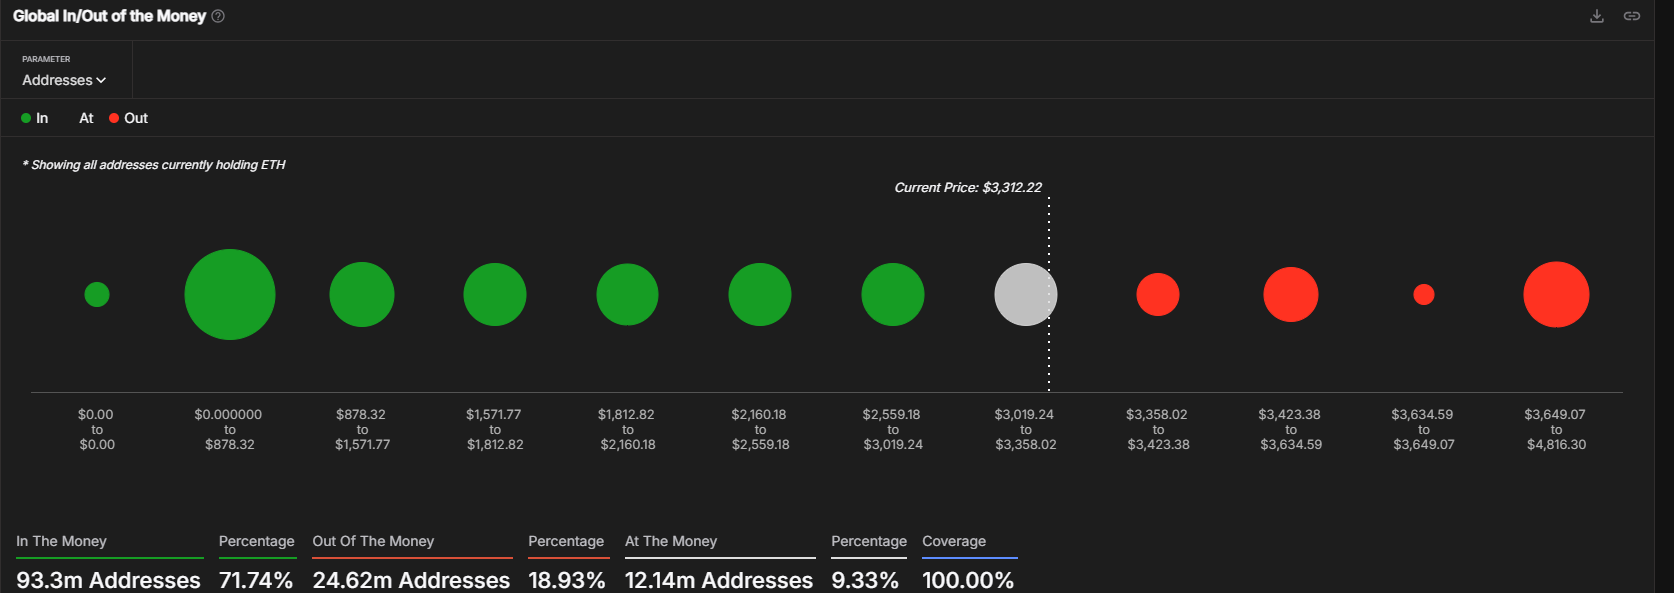
It was a strong demand zone and could prevent ETH from sliding below the level. However, ETH might find it challenging to surpass $3600, because more than 9 million addresses purchased ETH and are holding at a loss.
Despite the intraday decline of over 9%, Ethereum’s active addresses showed an increase of over 0.70%, which represents steady demand for the coin.
However, the futures Open Interest (OI) shed over 5.54% to $30.42 Billion, highlighting long unwinding movement over the past 24 hours.
Disclaimer
This article is for informational purposes only and provides no financial, investment, or other advice. The author or any people mentioned in this article are not responsible for any financial loss that may occur from investing in or trading. Please do your research before making any financial decisions.




