
 Quack AI
 NEAR Protocol
 Pearl
Pearl Zcash
Zcash Quant
Quant Pudgy Penguins
 Quantus
- BONK price has been capped inside a falling wedge pattern and retested the 200-day EMA mark.
- Technical indicators and market sentiments conveyed bearishness.
Bonk (BONK), a Solana-based memecoin, recently consolidated within a falling wedge pattern. It has been forming the lower highs and lower lows. Furthermore, the BONK price slipped to the make-or-break zone of $0.00002600, close to the 200-day EMA mark.
However, the memecoin formed a strong bottom around $0.00002500, signaling a potential reversal from here. At press time, BONK price was trading at $0.00002802, down by 0.78% in the 24 hours.
The token was capped in a prolonged downtrend and lost over 28% of its value in a month. Its market cap has declined to $2.14 Billion, ranked 54th in the overall crypto market. The total supply stood at 90.95 Trillion, whereas the trading volume dropped by 15% intraday.
A Reversal Or Trend Continuation?
Following a 220% surge in November 2024, the BONK crypto continued to drain its gains. Furthermore, it remained under the bears’ control. The price action chalked a falling wedge or descending wedge pattern.
Despite the decline, the BONK coin price managed to hold the 200-day EMA mark. That could play a crucial role in its potential recovery.
The BONK crypto price rested close to the tip of the lower wedge, creating a possibility of a downside breakout. However, it was at its most crucial liquidation zone, and the Bulls may have succeeded in defending it.
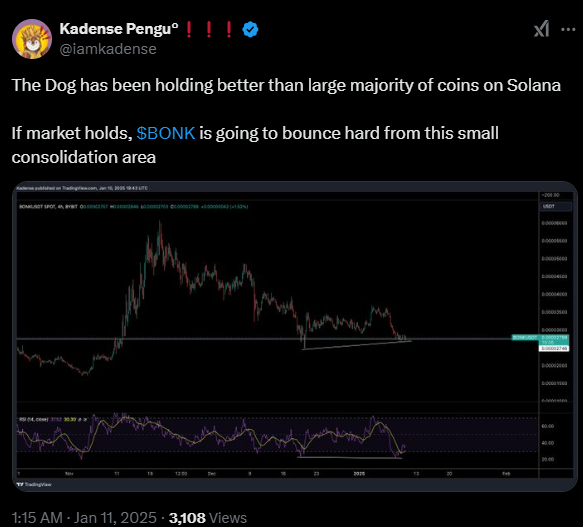
A recent tweet by @iamkadense highlighted in his post that the BONK price has been holding its support zone. If the bullish market sentiment resumes, then it will bounce hard and may outperform.
BONK Price Prediction: Key Levels To Watch
Per the daily charts, crucial support is positioned at $0.00002500. At the same time, the immediate resistance zone was seen at $0.00003000. The BONK price action suggested that $0.00003000 is critical to watch.
A daily close above this mark may see a trend reversal and escape the downtrend. However, the 9-day and 21-day EMA show a bearish crossover, signaling potential downward momentum. The bears could execute short-term weakening if the market closed below the $0.00002500.
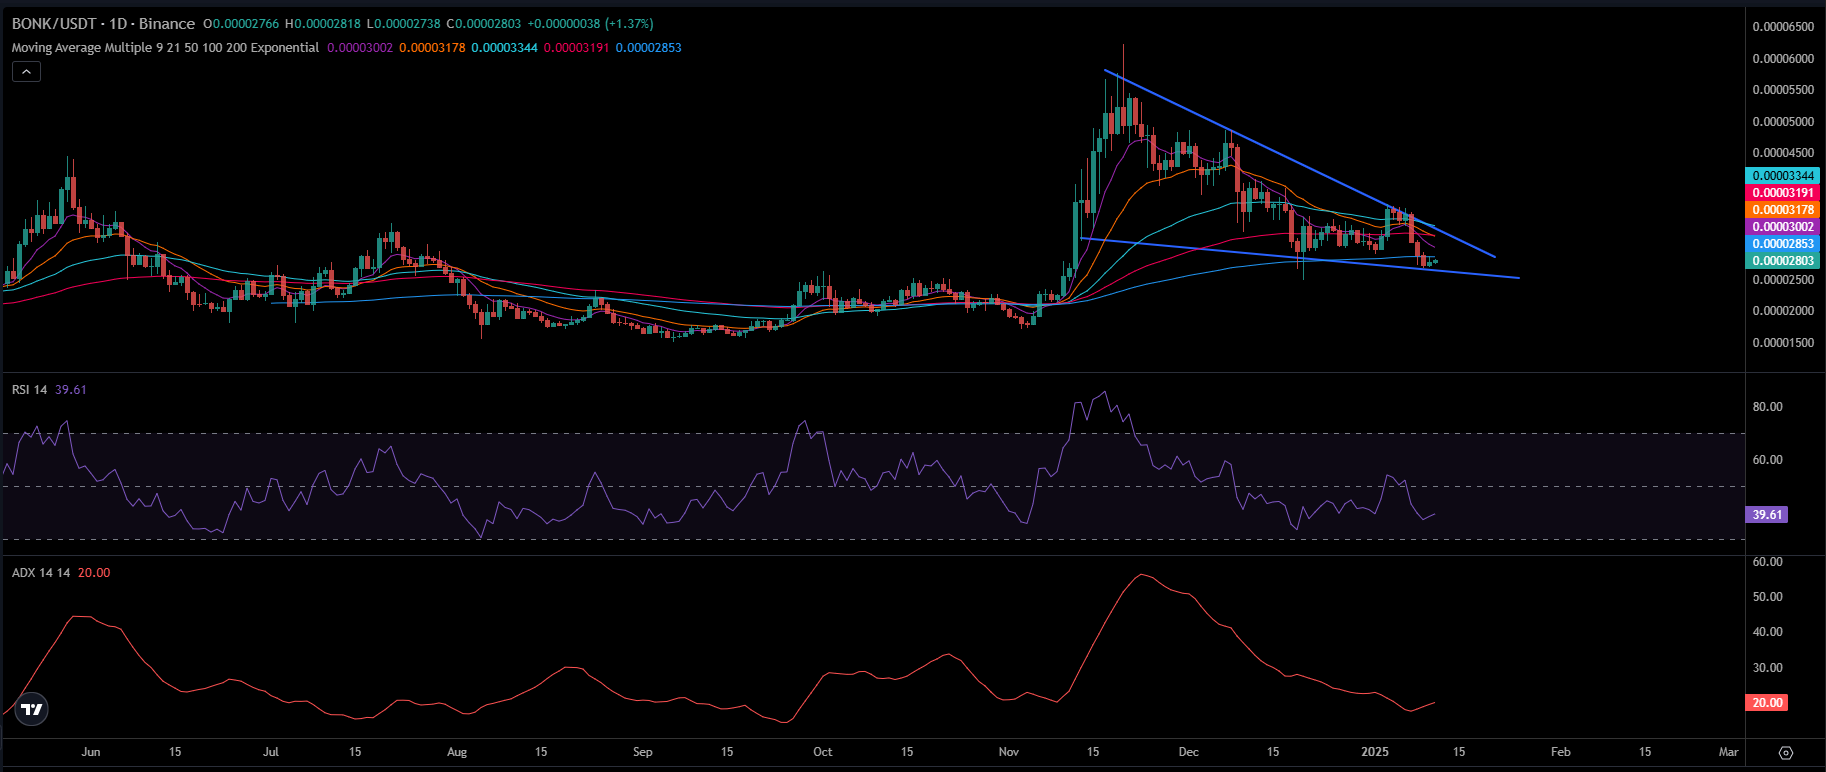
The Relative Strength Index (RSI) was 39, reflecting bearish momentum. It exhibited a heightened selling pressure, and bulls stayed on the back foot.
Moreover, the Average Directional Index (ADX) was close to 20, representing a lack of buying strength. Despite the short-term weakness, the market is cautiously optimistic about BONK’s potential for recovery.
Why are BONK Derivatives Leave the Market: Key Insights
Amidst the sustained price decline over the past few weeks, BONK crypto’s derivative volume saw a massive decline. Moreover, the token dropped to $36.20 Million.
Typically, a decline in volume means losing speculative interest among market participants. This suggested that more investors are refraining from trading.
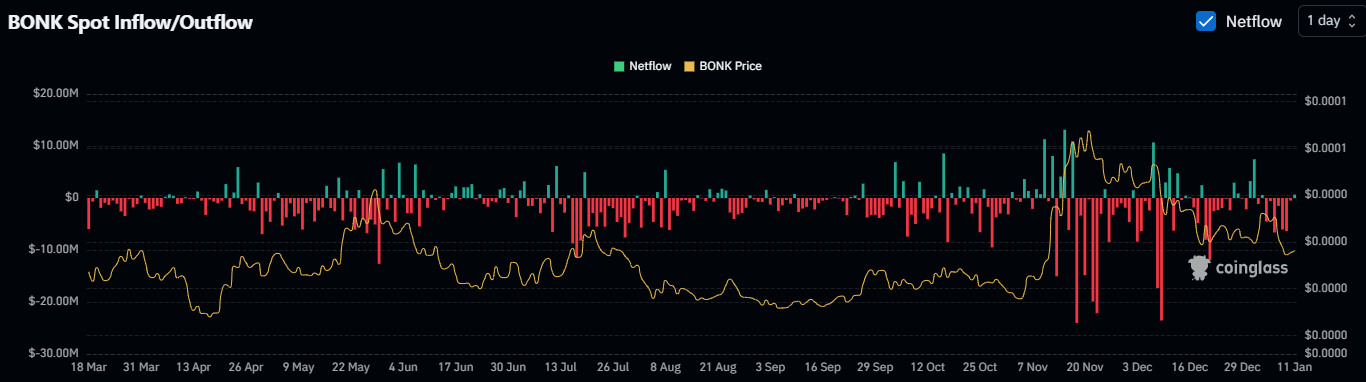
However, the spot market data from Coinglass showed an outflow of over $15.20 Million in the last seven days. Notably, such outflows refer to the withdrawal of assets from exchanges to wallet addresses for long-term holdings. That reduced selling pressure.
Disclaimer
This article is for informational purposes only and provides no financial, investment, or other advice. The author or any people mentioned in this article are not responsible for any financial loss that may occur from investing in or trading. Please do your research before making any financial decisions.




