no crying in the casino
 NEAR Protocol
 Starknet
 Pyth Network
 Pearl
Pearl Quantus
 Pudgy Penguins

- Long-term Ethereum holders show rising anxiety amid market shifts
- Grayscale Ethereum ETF sees significant outflows, holding over $4B in ETH
- Ethereum forms a falling wedge on the daily chart with potential volatility
Long-term holders of Ethereum (ETH) have expressed growing concern. These concerns were reflected in a move to the NUPL chart’s “anxiety” zone.
Meanwhile, Grayscale’s Ethereum ETFs have seen considerable outflows. This occurred as Ethereum’s chart’s falling wedge format indicated potential volatility ahead of forthcoming market events.
Rising Anxiety Among Long-Term Ethereum Holders
Ali Chart analysis showed long-term Ethereum holders changing their investment sentiment. Per Glassnode, the Long-Term Holder NUPL chart demonstrated growing anxiety levels among Ethereum holders.
The current sentiment shift reflected how holder’ feelings moved away from their previous confident belief. This happened during the Ethereum “optimism” period that projected its growth.
The NUPL metric measures profitability by demonstrating a transition to the “anxiety” zone. It represented a more cautious sentiment perspective.
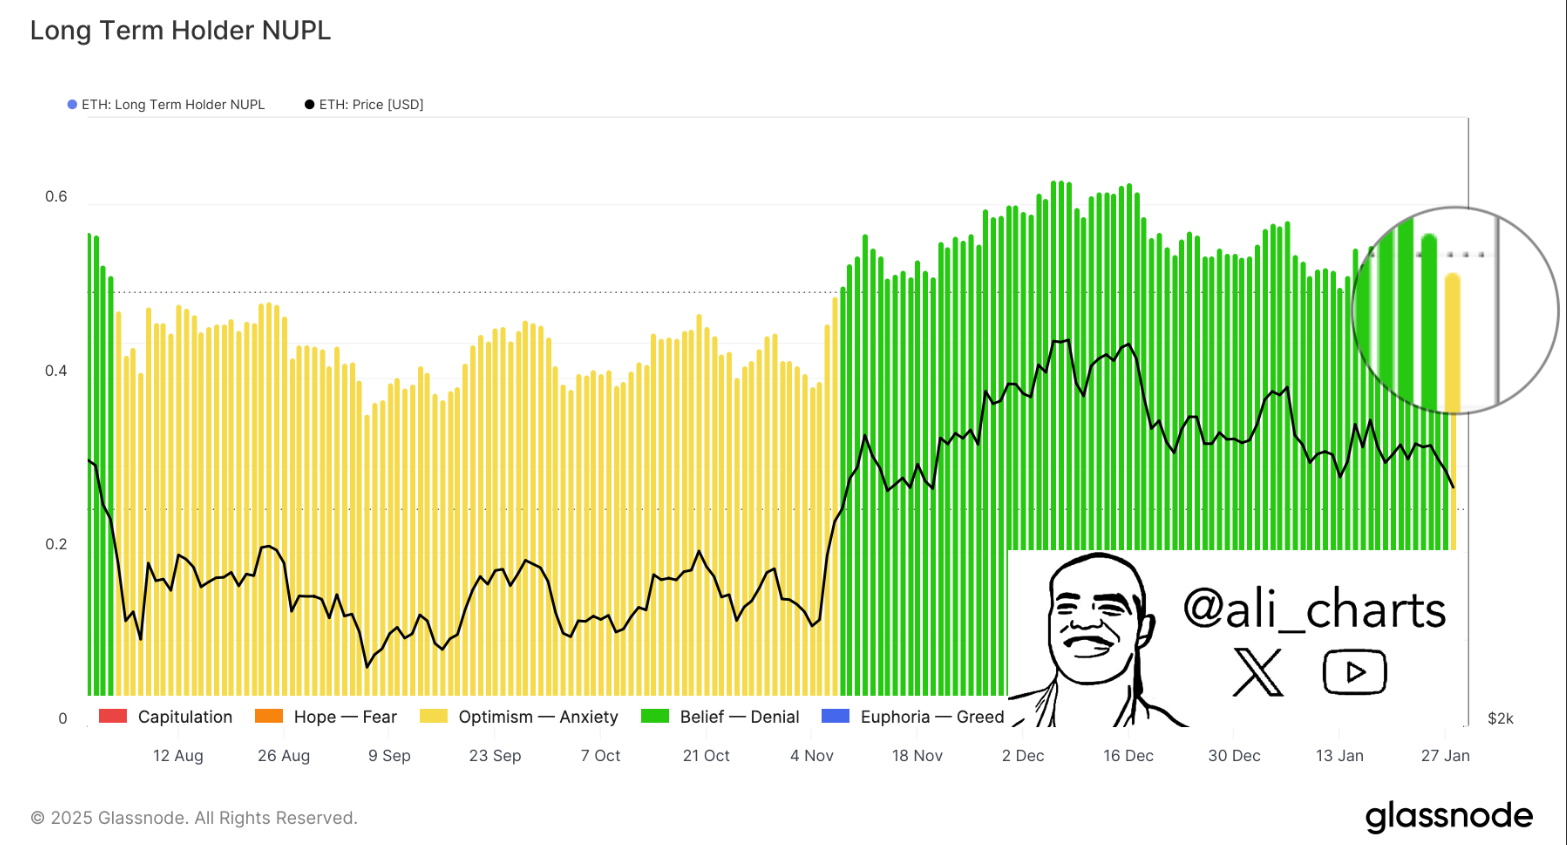
The Ethereum market optimism from holders has transitioned to caution due to recent price downturns. Many holders either reassess their positions or sell to make profits, accelerating market unease.
Beyond fleeting market jitters,Ethereum’s price path raises deeper systematic investor skepticism. Uncertainty among long-term owners might produce market volatility. This will further increase the possibility of price correction downward.
Grayscale Ethereum ETFs Witness Major Outflows
The Grayscale Ethereum Trust (ETHE) and other Ethereum ETFs have faced substantial fund withdrawals. This feeds into general market concerns.
Investors have withdrawn 26,885 ETH, equating to around $83.07 Million, from the Grayscale ETF, indicating changing market beliefs. Current outflows showed that institutional investors had reduced Ethereum product investments, leading to greater market uncertainty.
Grayscale Ethereum Trust maintains 1,349,715 ETH as current assets at $4.17 Billion. This made it among the largest Ethereum ETFs.

Despite the fund preserving its prominent Ethereum position, investors’ trust in the cryptocurrency showed signs of decline. Recent market conditions have led institutional investors to reevaluate their investment approach to Ethereum. They once saw this as a promising opportunity.
The release of Ethereum assets from Grayscale’s ETF mirrored current crypto market patterns. It showed institutional investors moving away from large Ethereum holdings.
Ethereum Forms Falling Wedge Pattern Breakout Ahead?
An analysis of the daily chart by Titan of Crypto showed that Ethereum is developing a falling wedge pattern. This traditionally signals an upcoming bullish breakout.
Ethereum’s price has demonstrated consolidation behavior. This further showed descending support and resistance levels together with converging trendlines.
The analysis demonstrated that the price has broken through the upper boundary of a falling wedge pattern. This historically marked the beginning of a market reversal.
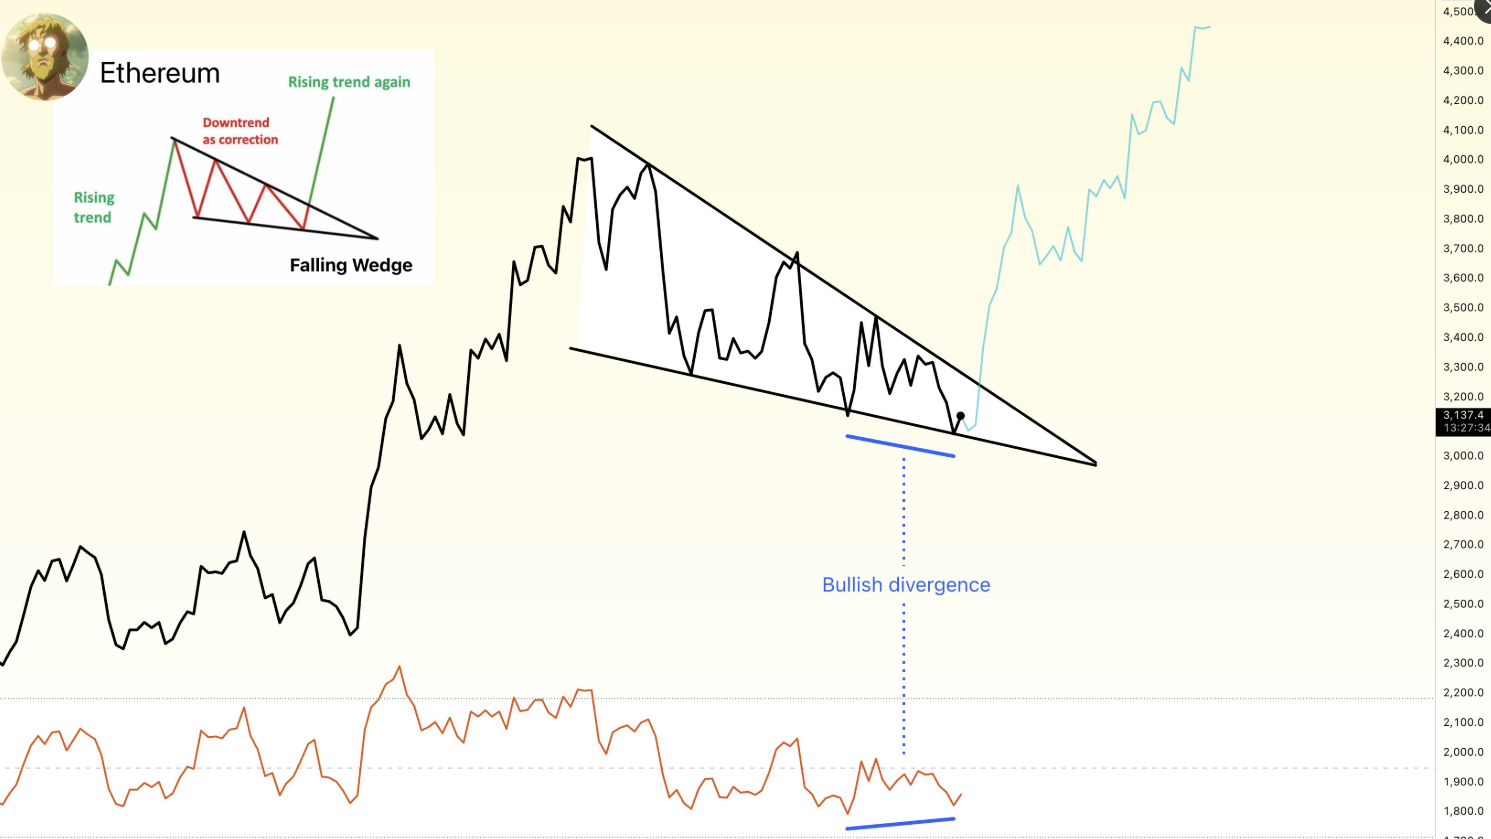
A supportive element for the potential breakout emerges from bullish RSI divergence patterns. The decline in Ethereum’s market price now shows improving momentum. This pointed to the onset of growing buying activity, according to RSI readings.
The current market narrative started to twist when Ethereum exhibited strong signals of potential rebound awaiting broader market propulsion. Following the recent Federal Open Market Committee (FOMC) meeting, the US Federal Reserve maintained interest rates at 4.25% to 4.5%.
The US Fed maintained interest rates at 4.25% to 4.5% on steady unemployment rate metrics because of rising inflation. The Ethereum price has increased by 1.20% to $3,136 in response to recent news events.
While the Fed’s choice to maintain stable interest rates achieved market stability, price instability persists, specifically in cryptocurrency markets. The falling wedge sequence forming on Ethereum’s chart and RSI divergence signals a future possibility for a market breakout.
Disclaimer
This article is for informational purposes only and provides no financial, investment, or other advice. The author or any people mentioned in this article are not responsible for any financial loss that may occur from investing in or trading. Please do your research before making any financial decisions.