
 Sword Inu
 no crying in the casino
 streamoors
 IGNITION
 Altai the Tiger
 Pearl
Pearl Quantus

Key Insights:
- BTC appears to be experiencing resistance at $107,452, which is near important Fib retracement levels.
- A high amount of $648M liquidated makes it clear that the market is very volatile.
- BTC price should not fall below $100,773, or it may go back to $92K.
Bitcoin (BTC) approached critical resistance at $107,452 this week as rising volatility fueled caution across the market. Analysts warn that holding above $100,773 is vital, while overleveraged positions triggered over $648 million in liquidations.
Bitcoin Price Faces Key Resistance Zones
Bitcoin approached the 161.8% Fibonacci extension at $107,452. Analyst Man of Bitcoin identified $100,773 as key support, linked to the 100% extension.
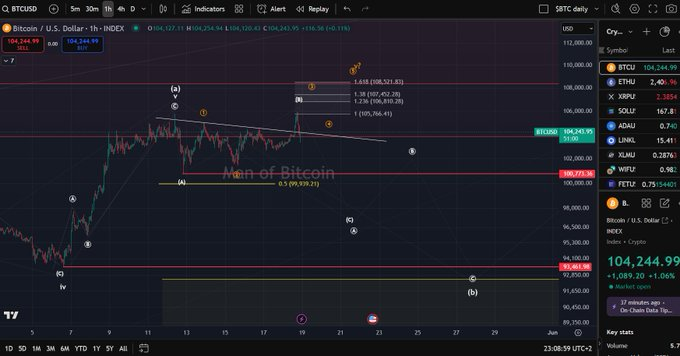
The next key resistance will likely arise at the 161.8% extension, which coincides with wave three projections found in Elliott Wave models. Man of Bitcoin pointed out that this level is crucial for confirming that Bitcoin has moved into a new wave. If the resistance is broken, it may cause the price to immediately move higher, aiming for $110,000, a significant psychological level.
However, if this level does not break, it may cause a fall in prices. Maintaining the bullish trend largely depends on the $100,773 support level. Should this level be broken, the selloff could spread lower, striking the area around $98,000. This target coincides with the lower Fibonacci retracements.
Support and Resistance Zones Remain Critical
Ali Martinez further pointed out that it is important to watch out for support and resistance zones. He stated that, in the past, the prices have found it difficult to exceed $106K to $107K. Many traders choose this range for short-term trading as it has seen many sell-offs.
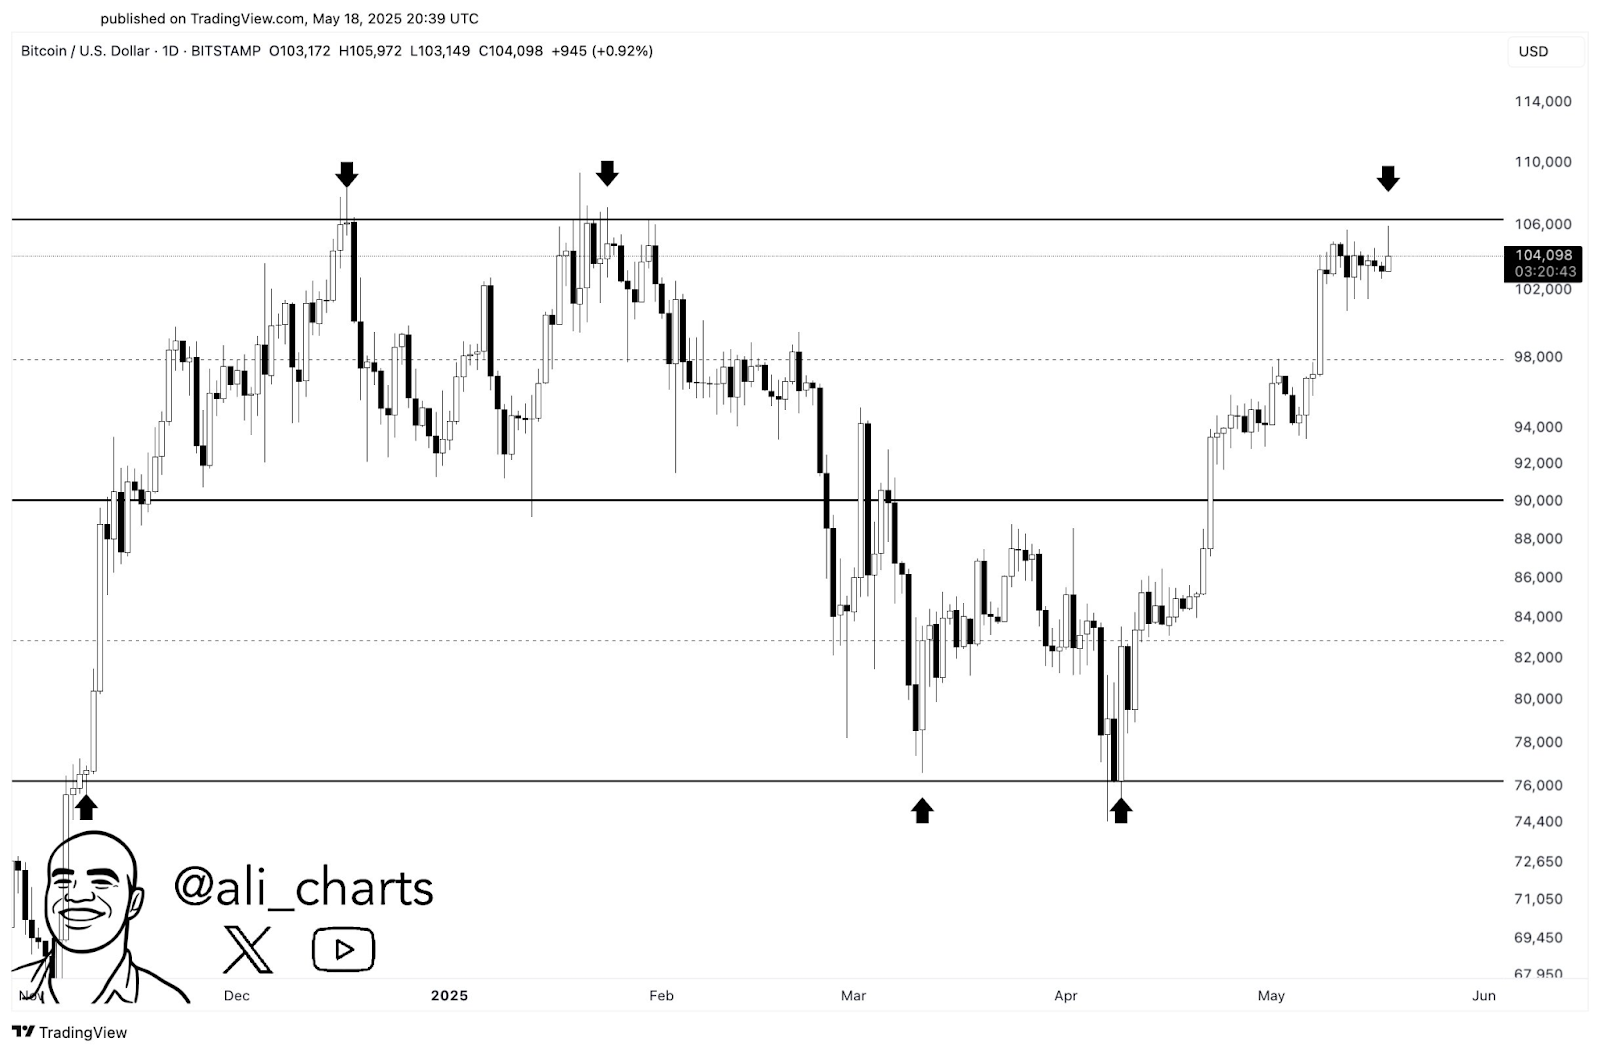
Moreover, the $100,773 level is significant because it joins the Fibonacci support with a major horizontal support. Should this level break, BTC price has a good chance to drop down to $98,000 and $92,000, which were areas previous buyers found attractive. Maintaining the expected positive trend in the medium term depends on these levels.
Liquidation Data Highlights Market Stress
The rise in Bitcoin’s volatility these days is mainly due to intense liquidation. According to Cas Abbé, Bitcoin liquidations have gone up significantly over the last 24 hours. There were $421.99 million in long liquidations and $226.47 million in short liquidations, suggesting lots of pressure affecting trading on both sides of the market.
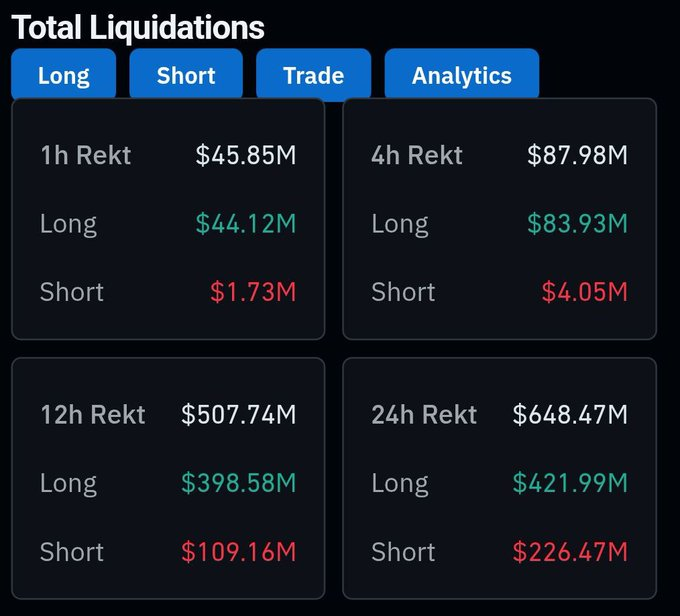
Notably, a quick rise from $105K to $107K and then a sudden drop to $103K point to liquidation hunting in the market. It suggests that market makers are finding those who are weak and making them trigger their stop losses to sell their position.
Consequently, a surge in liquidations usually means that traders are making use of high debt. This means there is an increased risk of sudden price movements, which makes it hard for traders to keep positions without facing major losses. Such quick liquidations can indicate coming shifts or big changes in the market trend.
Bitcoin Price Prediction: Technical Indicators Suggest Caution
Daily Relative Strength Index (RSI) readings show BTC nearing overbought territory. An RSI above 70 often signals potential profit-taking and short-term pullbacks.
Meanwhile, MACD shows bullish momentum fading. Though still above the signal line, the narrowing gap suggests slowing strength. A crossover could confirm a short-term trend reversal.
Volume has also dropped despite the BTC price surge. This divergence often signals exhaustion—fewer participants are buying into the rally, weakening its sustainability.
Disclaimer
This article is for informational purposes only and provides no financial, investment, or other advice. The author or any people mentioned in this article are not responsible for any financial loss that may occur from investing in or trading. Please do your research before making any financial decisions.




