Altai the Tiger
 IGNITION
 streamoors
 Sword Inu
 NEAR Protocol
 Injective
 Quantus
Key Insights:
- Shiba Inu price to rally as transaction volume hit 25.77 trillion, the highest in five months per Santiment data.
- A double-bottom pattern on SHIB’s weekly chart signals a possible bullish reversal if $0.000013 support holds.
- SHIB’s RSI stands at 42, indicating weak buying momentum despite a 4% daily price gain to $0.0000128 on June 7.
Shiba Inu (SHIB) price has been moving up recently due to strong momentum from buyers, suggesting a possible breakout may occur soon. According to market signals, the token might reach $0.000045 if key resistance levels break.
Shiba Inu Price to Rally as Daily Transaction Surge
Notably, on-chain data from Santiment showed that SHIB’s daily transaction volume rose sharply on June 5, reaching 25.77 trillion. Such levels have not been reached in five months, indicating stronger activity on the blockchain. A high trading volume usually shows that traders are active, mainly when it happens alongside changes in price.
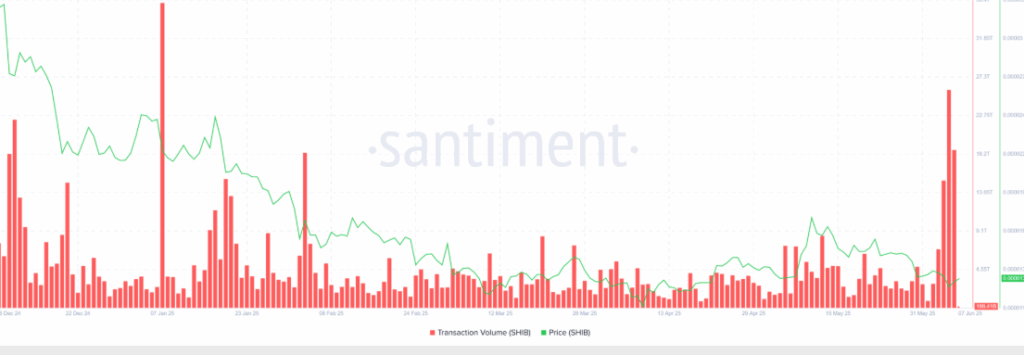
Additionally, over 18.68 trillion SHIB were moved on June 6. With this increased activity, Shiba Inu price has rose by 4% over the past 24 hours, according to CoinMarketCap.
SHIB price ranged between a low of $0.0000122 and a high of $0.0000128, where it was last observed trading. This increase follows a period of subdued performance across meme-based cryptocurrencies.
Technical Pattern Suggests Shiba Inu Price Reversal
Meanwhile, Shiba Inu price dropped below the levels that previously supported it, which caused some concern among investors. However, the weekly chart revealed that the meme coin was showing a double-bottom pattern. This structure often indicate a reversal when key price levels are respected.
According to the chart data, SHIBprice must hold the support at $0.000013 to keep the pattern intact. A previous bounce from this level in early April led to a short-lived rally, reinforcing its importance as a foundation for upward movement. If this support is not breached, the double-bottom formation may guide the next stage of price direction.
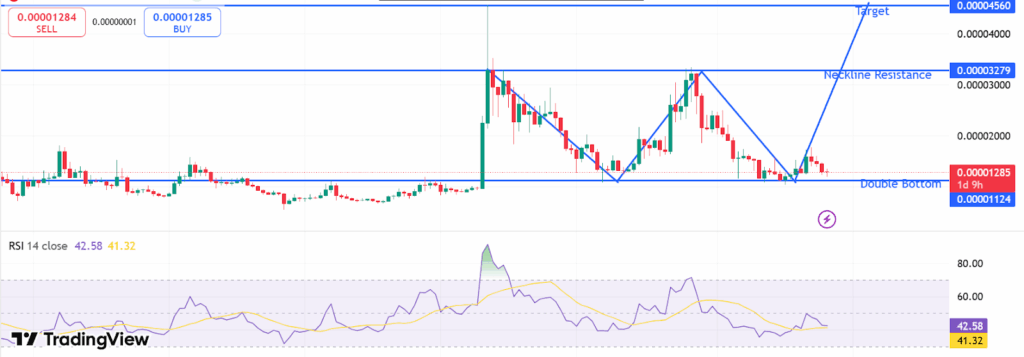
More so, the next resistance zone appears near the neckline of the pattern at $0.000032. Clearing this level could open the path for SHIB price to target $0.000045, which remains the projection based on the pattern’s formation and historical behavior. This scenario depends on whether bulls can sustain upward momentum over the coming sessions.
RSI Indicates Momentum Still Developing
However, despite its recent climb and structure, the Relative Strength Index (RSI) for SHIB is at the level of 42. The reading suggested that there is still bearish sentiment and the asset is not fully out of bearish control yet. A clear trend reversal would occur only if the RSI value goes above 50.
Notably, RSI is a critical tool frequently used to figure out if a cryptocurrency is overbought or oversold. A value below 50 generally reflects subdued momentum, while a value above 50 shows building pressure from buyers. Until this happens, the progress upwards may be slowed or even opposed.
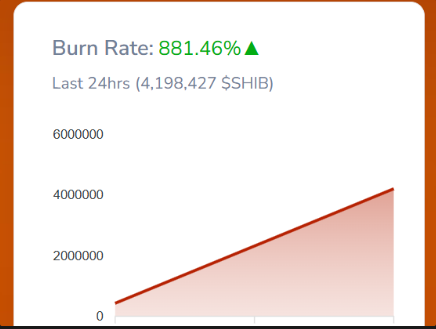
On the upside, Shiba Inu destroyed over 4.19 million tokens in the past 24 hours, a rise of 881.46%. With this strong growth, the company is clearly focusing on limiting the number of coins available, which could help stabilize or rise in prices. The steady increase in the chart showed there was constant token burning throughout.
Further supporting a bullish outlook, recent analysis suggests Shiba Inu price may be gearing up for a breakout toward $0.000081. Analyst Javon Marks identified a pattern of higher lows and strong base-building behavior
Another analyst, Alpha Crypto Signal, noted SHIB price was attempting to flip the mid-level of a descending channel into support. If confirmed, this setup could open the path to $0.000040 and eventually target $0.0001553, representing a 450% potential gain.
Disclaimer
In this article, the views and opinions stated by the author or any people named are for informational purposes only. And they don’t establish the investment, financial, or any other advice. Trading or investing in cryptocurrency assets comes with a risk of financial loss.