Pearl
Pearl Pudgy Penguins
 NEAR Protocol
 Quack AI
 Canton
 Starknet
 Derive
Key Insights:
- The Ethereum price is at $2,568.10 with a 1.76% daily increase and volume up 66.74%.
- Ethereum’s Total Value Locked has jumped 41%, as Whales also stack up.
- A confirmed inverse head and shoulders pattern points to $3,000+ as the next target.
The Ethereum price is showing strength once again. At the time of writing. Ethereum price was down to $2,568.10. This was a 1.76% rise in the past 24 hours.
The upward trend is occurring during a great bullish indication technically. The Total Value Locked (TVL) of Ethereum has increased by 41% over the past weeks.
All signs now push in the direction of the continuation of the bullish trend, with the target of reaching the level of 3,000 becoming more real with every passing line of the bullish trend.
Ethereum Price Stands Above $2,500 with Increasing TVL
The most recent trend in the Ethereum price shows a stable bull run. It opened at approximately $2,511, but increased towards the $2,590 point before slipping towards the $2,568 point by press time.
Ethereum trading volume has also increased by 66.74% to $14.83 billion. It could mean institutions are stacking up ETH. Ethereum price charts show a breakout pattern in a sideways consolidation zone, which saw bulls repossessing the psychological support base of 2500$.
Among the prominent on-chain events supporting the rally in the price of Ethereum has been the all-time highs in the Total Value Locked (TVL). As shown by Artemis data, the TVL of Ethereum has increased by 41% or approximately 29.3 billion in April, going to the current figure of 64.3 billion.
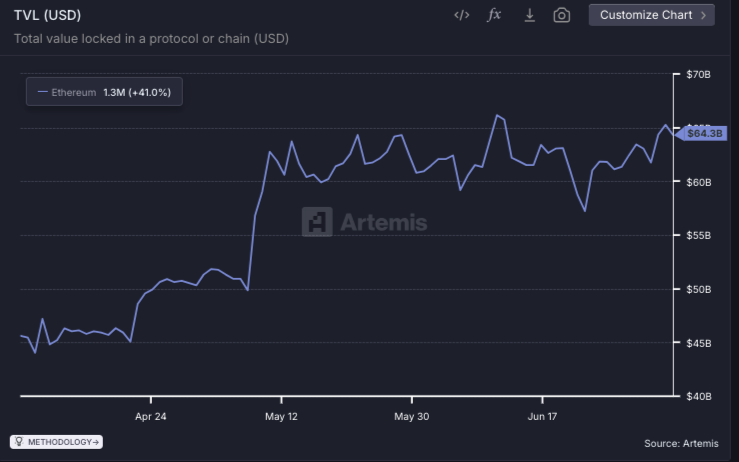
An increase in the amount of capital held in Ethereum-based protocols is a sign of better user usage and confidence in the network. It also works efficiently to cut down the liquid supply, which could contribute to a jump in the Ethereum price.
The TVL chart indicates a significant breakout, which started in late April and continued in a solid uptrend during the months of May and June. Ethereum TVL has then recovered, with only a few dips in early June. That took Ethereum close to where the TVL position was at the beginning of the year.
The boost in capital inflow is especially significant because of the risk-averse tone of the wider market. It implies that Ethereum is once again gaining its position as the most popular smart contract platform.
Whale Activity Suggests Long-Term Confidence on Ethereum Price
Whales have also been stacking up. A whale recently pulled out 1,900 ETH, worth about $4.86 million. This wallet has already withdrawn and staked 6,989 ETH ( 17.5 m) in the last three weeks. This trend of uninterrupted growth and placement is important.
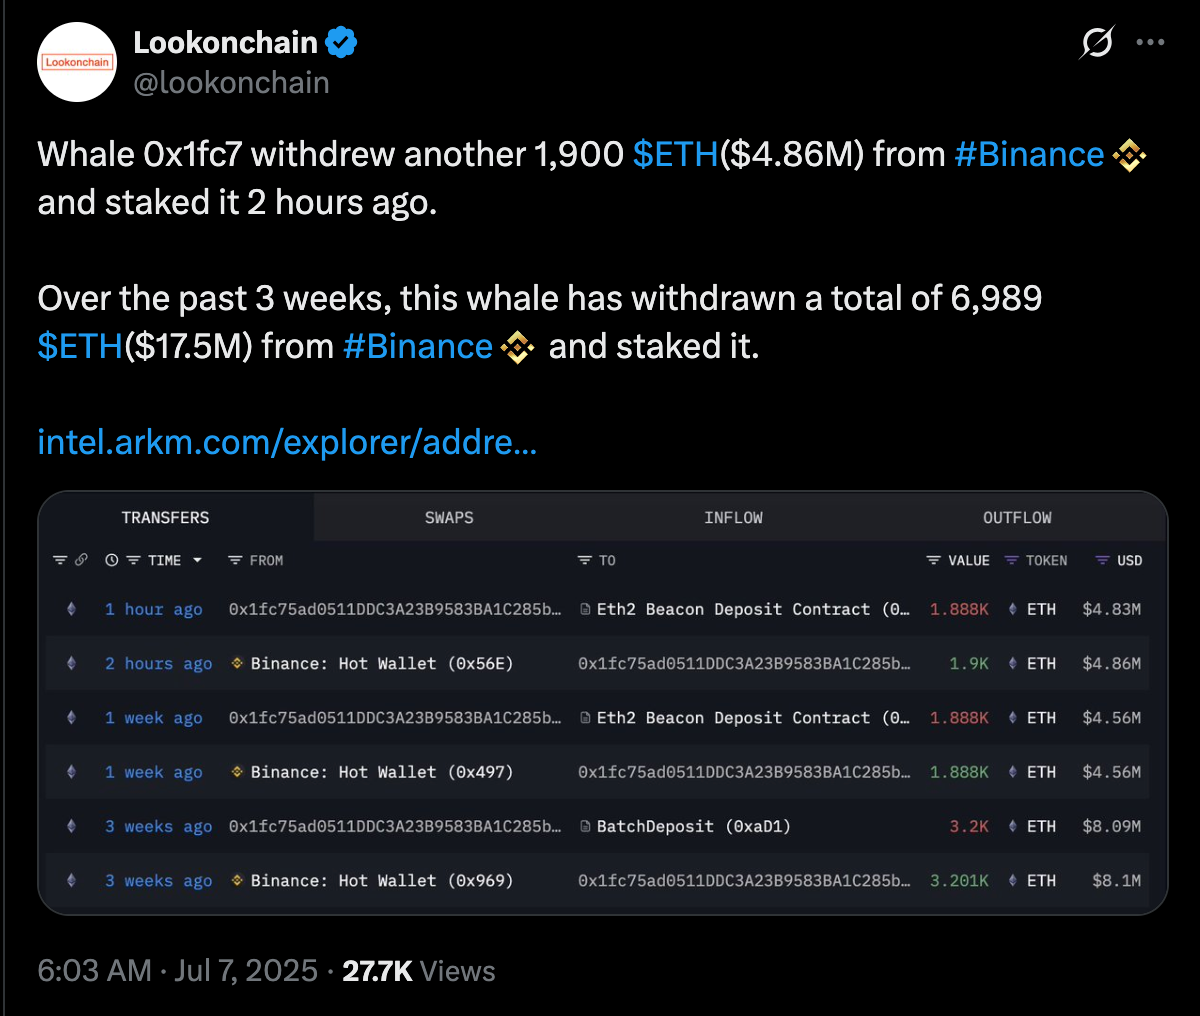
Removing ETH during staking operations of centralized exchanges and into a staking platform increases demand for token supply withholding in circulation. It could mean a long-term bullish outlook on the Ethereum price developments and underlying ecosystem.
Ethereum Price Chart Shows an Inverse Head and Shoulder Pattern
The Ethereum price trend also displays a super powerful bullish trend after a rough couple of days. On the 2-day ETH/USD chart, an inverse head and shoulders pattern has been formed properly.
Such a traditional reversal pattern receives the left shoulder (in February 2025), deeper head (March-April), and right shoulder (June-July), and the neckline will be constructed at some $2,500.
The neckline has been broken today, and the bullish reversal pattern seems to hold. The estimated price target of this breakout is weighing over $3,800.
$3.800 is a mid-term goal. The current resistance levels are at 2.600, followed by psychological resistance levels at 2.800 and 3.000.
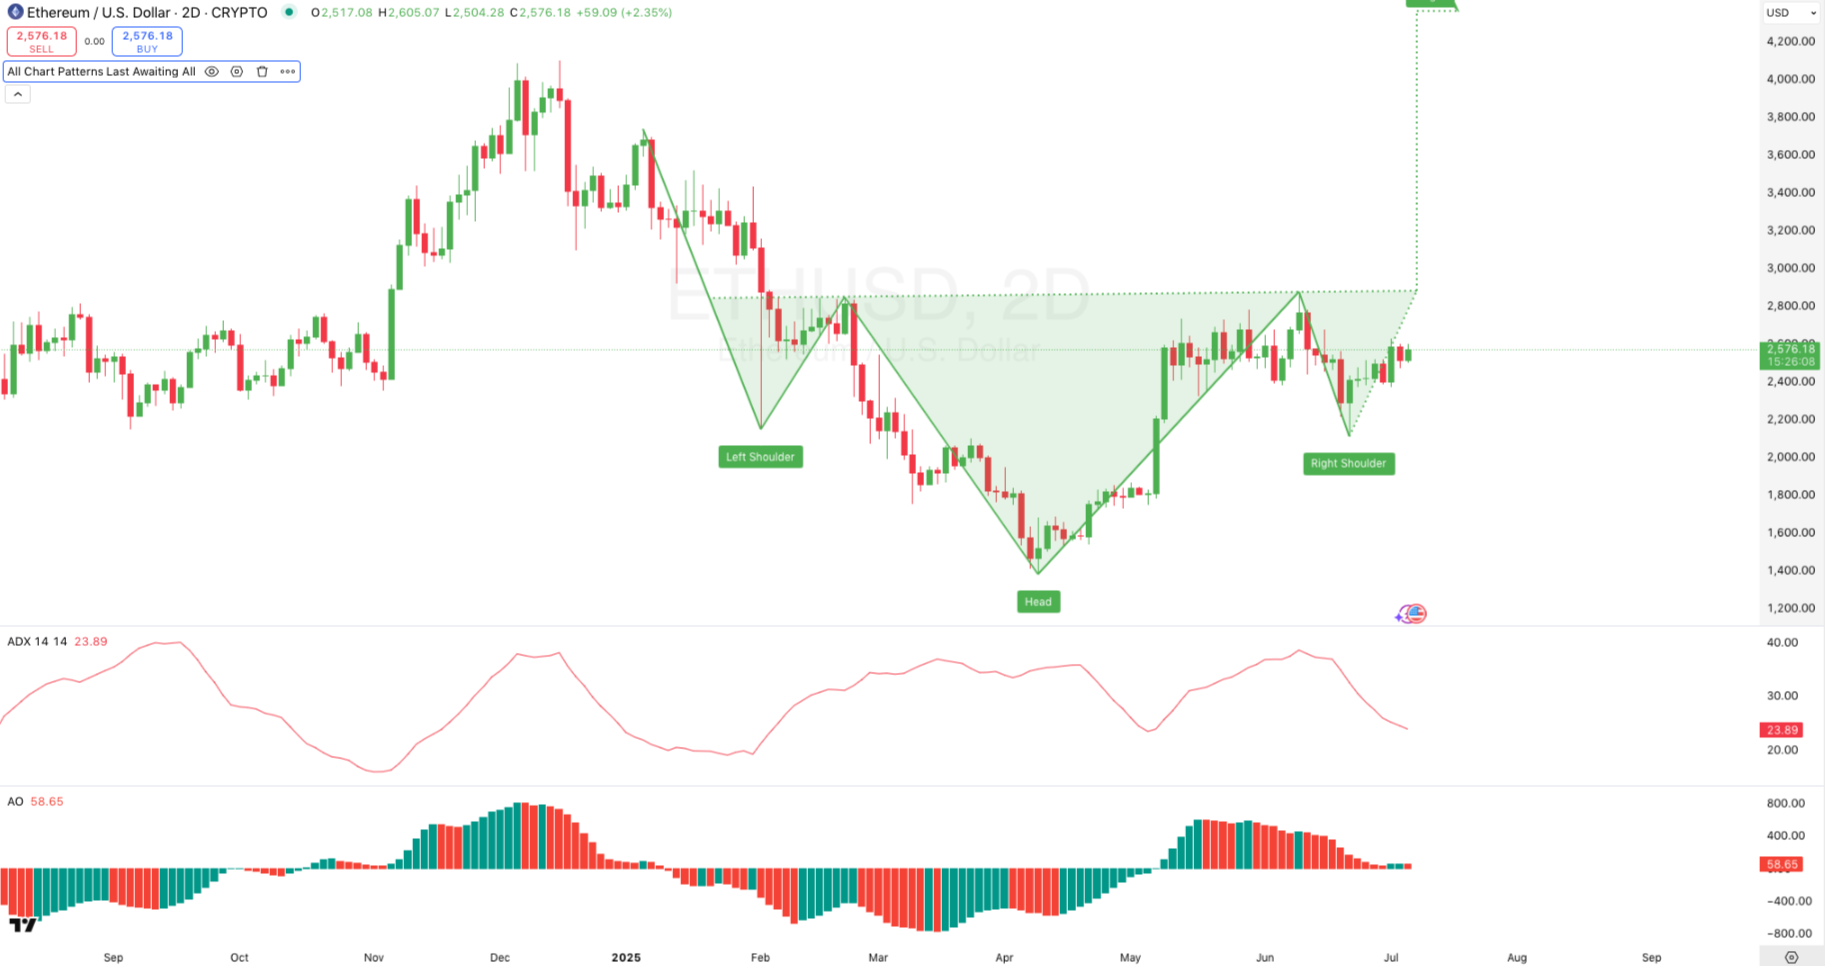
The Awesome Oscillator (AO) has now gone bullish by changing its color to green and its histogram bars. The ADX indicator is at 23.89, inferior to the value of 25. It shows the strength of the trend, slowly growing.
This is an indication of a budding pattern that can become more powerful under longer-term purchasing movements.
As long as Ethereum price operates above the $2,500 neckline and volume remains high, the technical stance may push the price action closer to $3,000 in the short term.
Disclaimer
This article is for informational purposes only and provides no financial, investment, or other advice. The author or any people mentioned in this article are not responsible for any financial loss that may occur from investing in or trading. Please do your research before making any financial decisions.