Covenant x402
 Doge Pepe
 Tetsuo Super Intelligence
 Claudia
 Boomer
 hi
hi Quantus
Key Insights:
- Dogecoin price holds strong above $0.20 support level.
- A breakout above $0.235 could trigger rapid bullish momentum.
- Hammer candle signals bullish reversal, boosting confidence in the uptrend.
Dogecoin Price has climbed over 15% this week, reflecting the broader bullish trend in the cryptocurrency market. The meme coin remains strong above the $0.20 mark, signaling continued investor interest. Analysts now anticipate a possible move toward $0.30 as bullish momentum builds. A recent candlestick pattern further supports the upward outlook for DOGE in the coming sessions.
DOGE Nears Key Breakout Above Resistance Line
A crypto analyst has pointed out the Dogecoin price to a major technical obstacle. The digital asset is approaching a lengthy sinking resistance trendline that has been holding its bullish momentum so far.
Dylan points out that a confirmed breakout on the 2-day chart above level 0.235 might cause an intense bullish run.
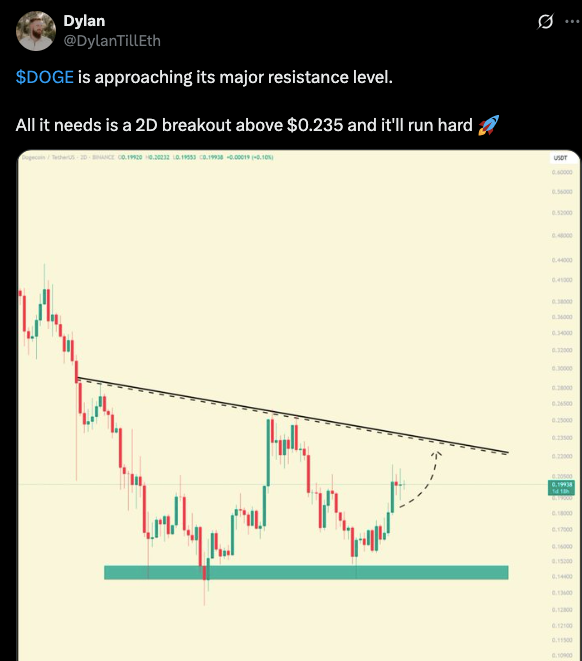
The line he provided in the chart presents an obvious resistance line, which was made up of the past swing highs. In case DOGE succeeds in closing above this residence zone, it might produce fresh interest of investors and buying pressure.
All these setups have the momentum that seems to be picking up since Dogecoin was earlier hitting some steady demand areas down low. Historical trends show that once DOGE breaks above such patterns, it is likely to move up sharply.
Dogecoin Price Forms Bullish Hammer Candlestick Pattern
The crypto expert has outlined a hammer candlestick pattern on the daily chart of Dogecoin, which means that the crypto can make a trend normalization. Such a trend is generally considered as a bullish indication particularly when it follows downtrend or a consolidation period.
It is a small-bodied chunk of the range close to the top and a long bottom wick, which implies that though sellers first overwhelmed the price at some point, buyers took over the lead before the end of the session.
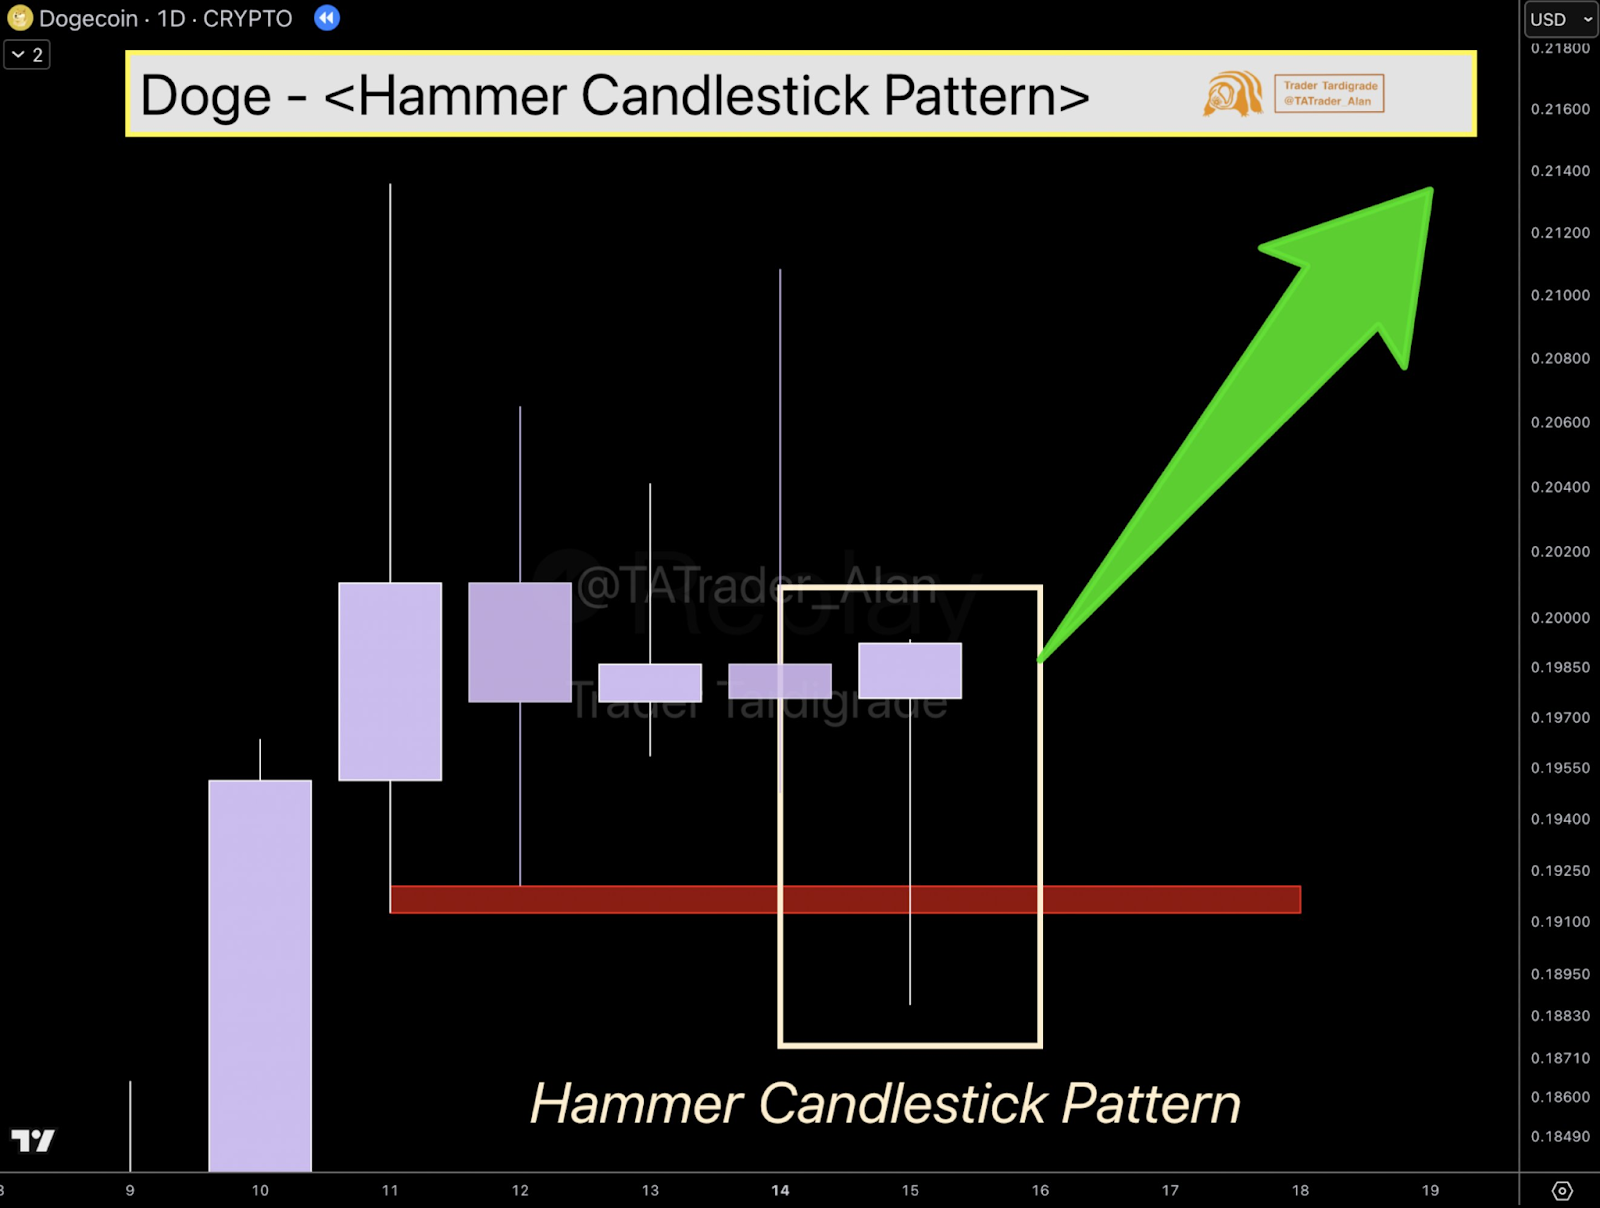
The shape is a common indication of a bullish turn in market conditions. It indicates that the selling pressure is weakening and buyers are getting active.
Provided that this is strengthened with further volume and price-rising direction in the upcoming sessions, this pattern may initiate a more vigorous rise of the Dogecoin. Analysts will often keep watch of these patterns to indicate any market turn arounds along the way.
Dogecoin Price Surges, Positioned for 50% Rally
The latest DOGE price action showed a sharp bullish breakout, pushing the token above the $0.20 psychological mark.
The Dogecoin managed to increase its price by more than 5% throughout the daily exchange, and it topped at 0.2030. This direction came in the wake of good buyer momentum in the token that had breached its long consolidation range.
Key resistance levels were breached as DOGE climbed past the $0.18 and $0.20 barriers. Technical indicators signaled continued strength in the uptrend. The Relative Strength Index (RSI) was at 65.37 and into bullish trend, yet it was not in an overbought position.
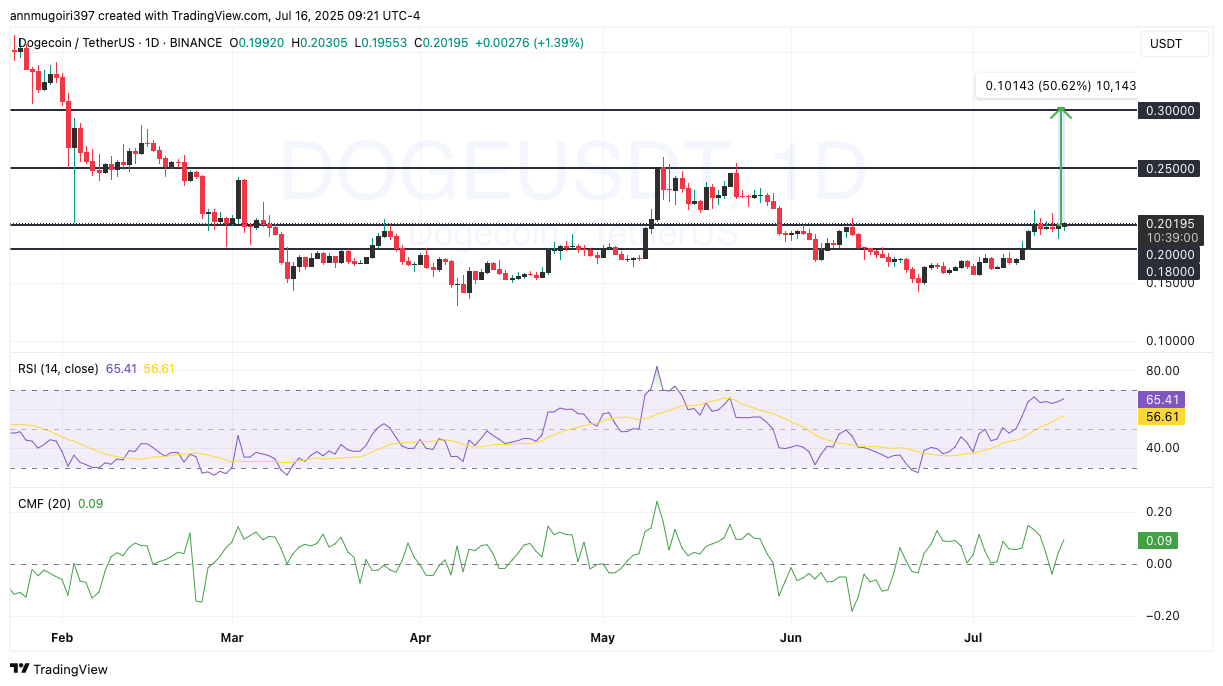
The Chaikin Money Flow (CMF) was at 0.09 signifying the inflow of capital and robust build up in the recent sessions.
After this breakout, the meme coins are targeting the bulls of $0.25 resistance area. Provided that the buying pressure is maintained, there might be another rally up to the area around the $0.30 level. Going by the above chart projection, this would be a 50% increase after the break out point.
The successful retracement of the support level at $0.20 will be watched by the traders to confirm the strength of the breakout. Failure to maintain over $0.20 would indicate a short-term pullback to $0.18.
On the positive side, there is strong momentum that favors the bulls with the breakout structure indicating a continuation rally in the near future.
Disclaimer
This article is for informational purposes only and provides no financial, investment, or other advice. The author or any people mentioned in this article are not responsible for any financial loss that may occur from investing in or trading. Please do your research before making any financial decisions.