Minter
 Quack AI
 Quantus
 Pudgy Penguins
 Bitcoin
 Bittensor
 Boomer

Key Insights:
- XRP price has broken out of a bullish flag on the weekly chart with a projected target near $15.
- A bullish trend ribbon flip has occurred on XRP’s weekly chart, confirming upward momentum continuation.
- XRP spot ETF approval odds are listed at 95% for 2025, with the SEC likely to view it as a commodity.
XRP price has exhibited resilience in various measures to spur expectations of a long-term rally. Regulatory advances and technical indicators seem to have correlated, offering a speculative price target of $15. Analysts have observed that the price dynamics and structural patterns have pushed this bullish outlook.
XRP Price has Broken out of a Bullish Flag
Notably, XRP price weekly chart showed a confirmed breakout from a long-term bullish flag pattern, according to technical analyst Ali Martinez. The formation began in late 2024 and extended into mid-2025, compressing price action into a tightening structure.
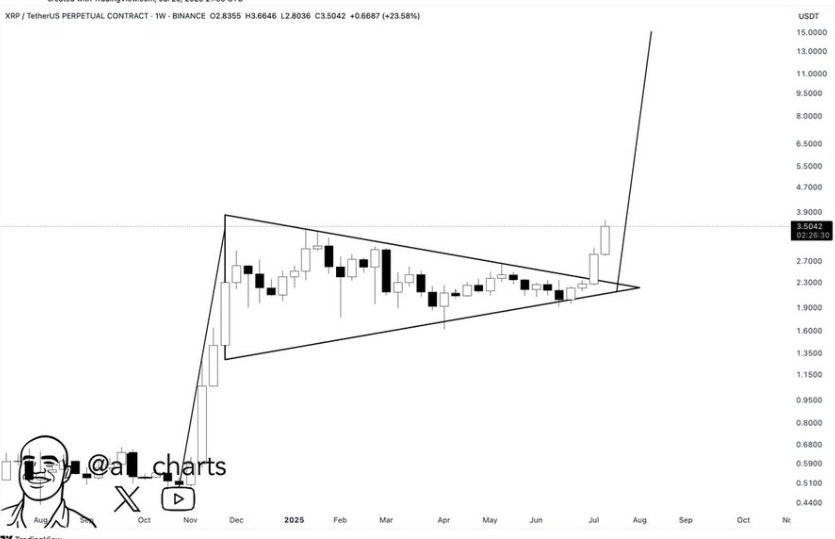
Additionally, this period of consolidation featured progressively lower highs and steady support, thus giving rise to a conventional flag, commonly followed by a continuation move. The altcoin broke out at the $2.70 resistance level with a huge bullish candlestick, and ended up closing near the $3.50.
This breakout candle recorded a weekly gain of over 23%. According to standard chart projection techniques, the height of the flagpole is used to estimate the target after breakout.
In this case, that projection extended toward the $15 zone. This pattern has drawn interest from technical traders looking for sustained momentum after consolidation.
A Bullish Trend Ribbon Flip on XRP Price Weekly Chart
Another technical confirmation came from a bullish trend ribbon flip on the weekly timeframe. Shared by analyst Steph Is Crypto, the trend ribbon, an indicator on moving average bands, has gone green and bent upwards.
Consequently, this move suggested that the top altcoin was rising on momentum above dynamic supports, which have aided additional upsides in the past.
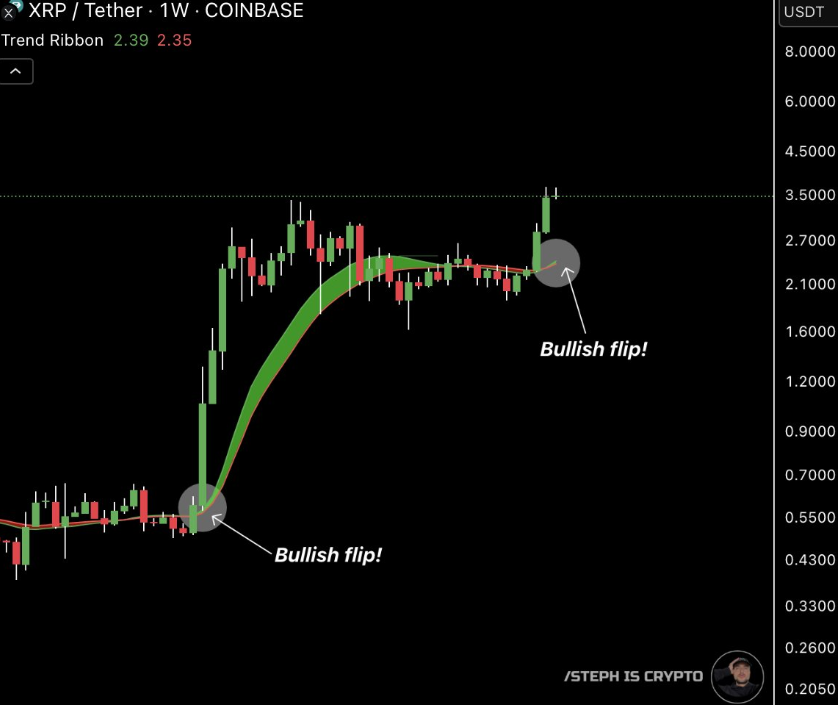
The chart also projected a similar ribbon flip in an earlier cycle, and a massive rally followed that in the XRP price. As this repeat structure was established, Steph noted a historical comparison to describe a reference of expectations around the current movement.
The shift in the ribbon into support and resistance zones placed XRP in structurally favorable areas that may likely witness continuation patterns. This flip and the recently triggered breakout have aided confidence in the ongoing uptrend.
XRP Spot ETF Approval Odds are Listed at 95% for 2025
In a recent update, analyst Steph Is Crypto shared a chart listing digital assets and their projected spot ETF approval odds. XRP has been assigned a 95% probability of approval by 2025. The table included filing details for firms such as Grayscale, Bitwise, Canary, and 21Shares, all of which have submitted applications for an XRP spot ETF. The final SEC decision deadline for XRP is October 17, 2025.
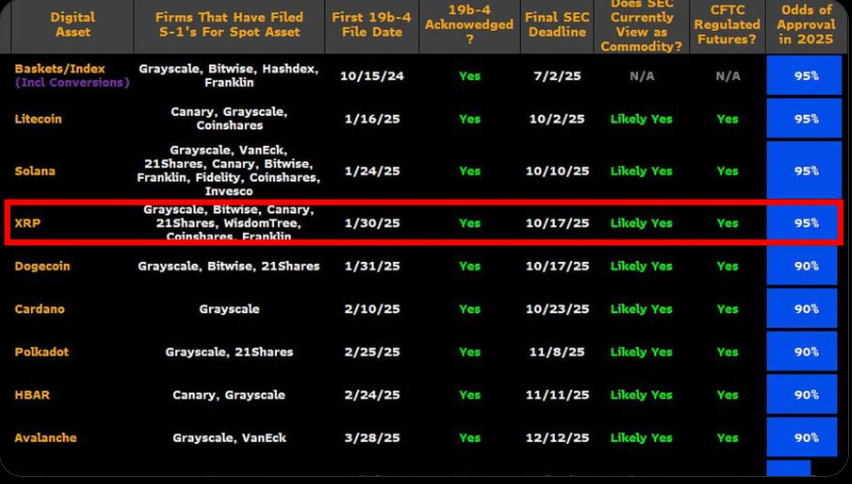
The same table notes that the U.S. Securities and Exchange Commission is “likely” to view XRP as a commodity. This stance aligned with the Commodity Futures Trading Commission (CFTC), which already included XRP among assets with regulated futures.
A dual recognition by the SEC and CFTC may streamline the approval process and increase the potential for institutional access through an ETF structure.
XRP Eyes $5–$8 After MACD Bullish Crossover
In a separate analysis, Mikybull Crypto noted a bullish MACD crossover on the weekly chart of XRP, which concurred with a prior breakout pattern in early 2025. The token broke above the Fibonacci 0.618 retracement level of $2.55. New targets stood between $5 and $8, according to an extended line of 1.618 at $5.32.
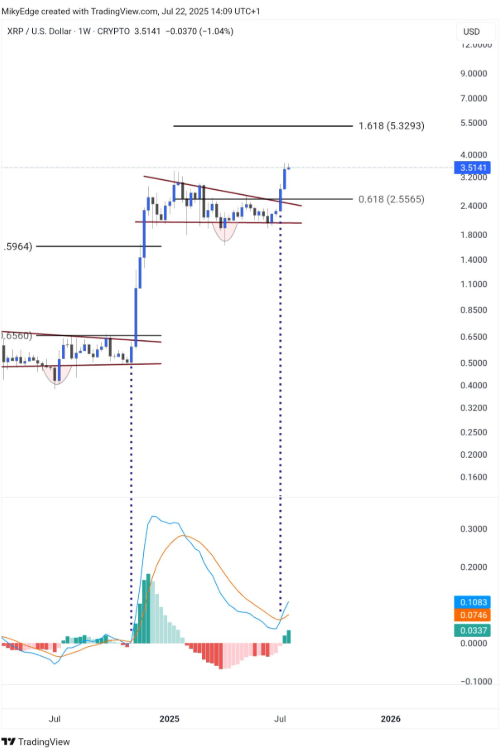
The MACD histogram also turned green with the MACD line continuing to advance, pushing in a bullish direction. The recent breakout strongly resembled the previous run of the $0.56 to $1.59, featuring almost the same consolidation and breakout patterns. In case of repetition, XRP price might reach mid-range resistance and then rally to higher extension levels.
Disclaimer
This article is for informational purposes only and provides no financial, investment, or other advice. The author or any people mentioned in this article are not responsible for any financial loss that may occur from investing in or trading. Please do your research before making any financial decisions.