Covenant x402
 Doge Pepe
 Tetsuo Super Intelligence
 Claudia
 Boomer
 hi
hi Quantus

The XRP price is officially out of its multi-year accumulation phase, signaling a new macro bull run. The latest outburst has sent XRP past $3, breaking a symmetrical consolidation channel dating back to 2018 and extending to mid-2025.
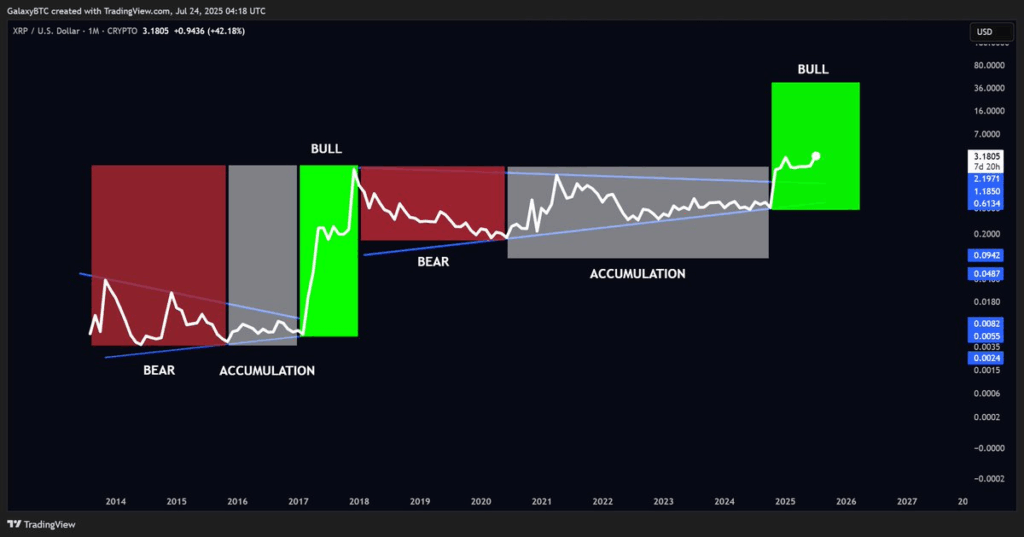
Structurally, the XRP price seems to have finished with a triple cycle pattern replicating its 2017 breakout.
XRP Price Shows Bullish Continuation Pattern from $1.90 Low
A bullish Elliott Wave count set of a medium-term size appears to be in progress. The impulse wave count started at a low of $1.90 and was labeled Wave 1.
The market is in its typical Wave 2 retracement, which could see it visit an important support zone of around $1.80-$2.00. A triple tap bottom structure implies strong interest in purchasing in this range by the buyers.
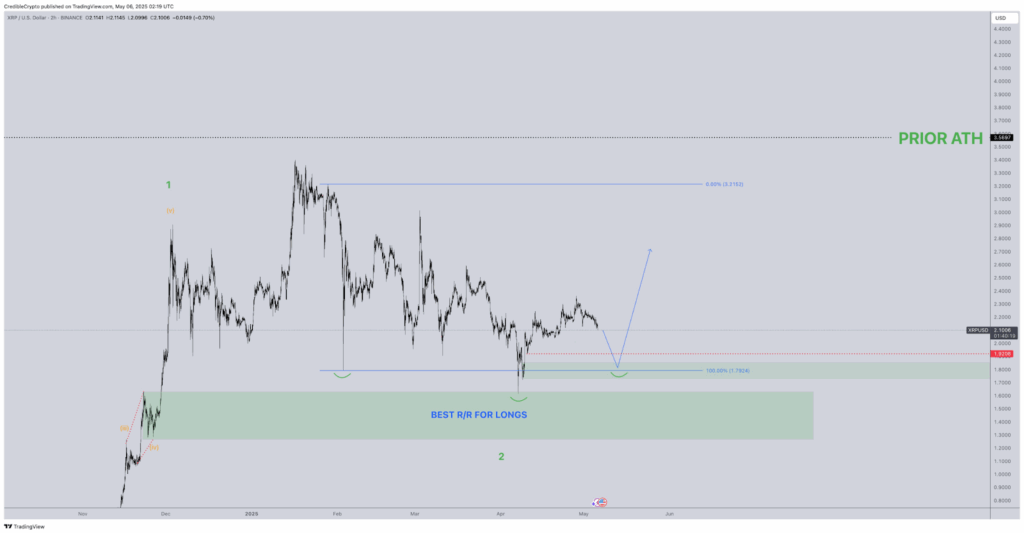
According to CrediBull Crypto on X, the present wave formation can finish a lower subwave (5) of a bigger Wave 1 movement. This shows an ongoing correction. The actions of prices at $2.00 will also be key to determining the end of the correction and continuation of the uptrend.
Supply and demand data of the higher timeframes give evidence of bullish power. The zone $3.20 to $3.25 which was once tagged as D3 supply has been reversed to support. It is this area that XRP is coagulating on, following a steep rise.
This is a major inflectionary point on the chart, with the pressure that showed itself on the sell side in the past having now become demand.
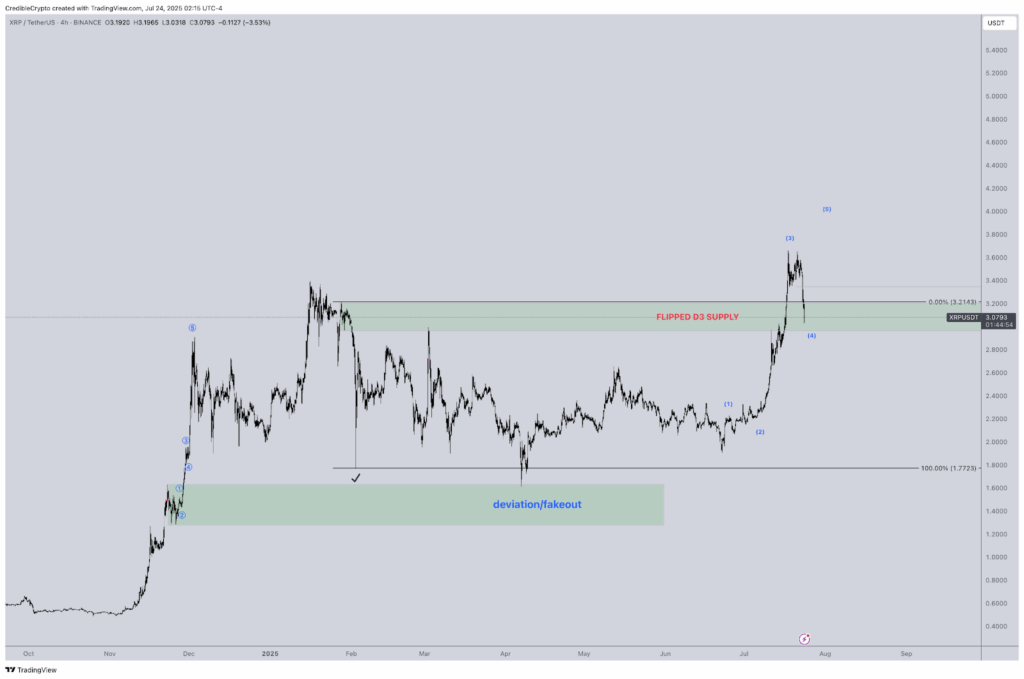
The retest of this flipped supply zone goes with the Wave (4) of Elliott structure. If it is maintained, the level will act as a stepping stone that will see Wave (5) reach its past all-time highs of over $3.80.
Rejection of this level would disqualify the flipped zone and redirect to mid-term support levels at $2.66 and $2.44. This is the most likely with the use of Fibonacci confluence.
Fibonacci Levels Show Short-Term Risk and Support for XRP Price
Fibonacci retracement levels determine the course of correction on lower timeframes. The XRP price has already struck the 0.618 level at $3.05, which is one of the normal correction points in an uptrend. In case this does not commence, the 0.5 level at $2.86 and the 0.382 at $2.67 will serve as back-up support levels.
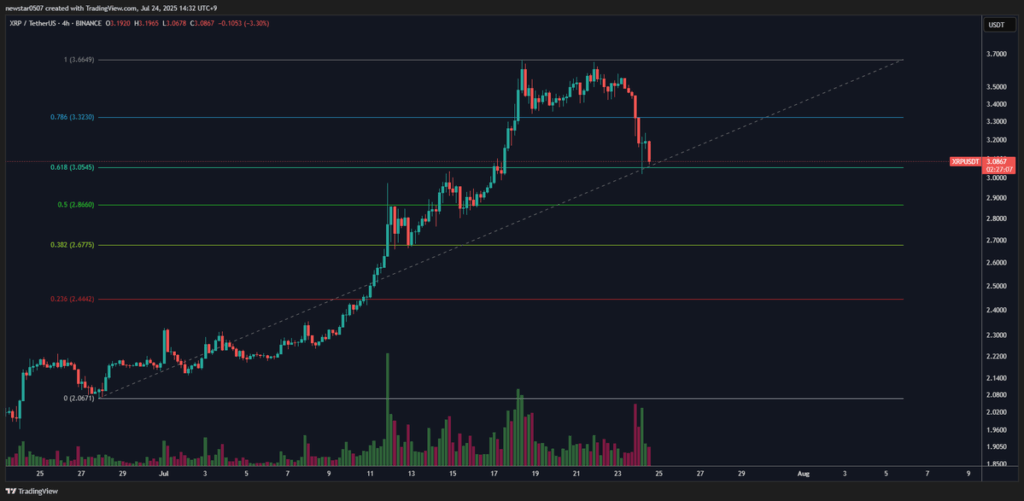
The volume investigation indicates that buying interest is high, and this is particularly the case in key support areas. The delaying trendline since late June also provides diagonal support at the levels of between 3.00 to 3.05. This trend will be equally important in maintaining the higher bullish trend.
Network Activity Confirms Bullish On-Chain Momentum
The on-chain data back the bullish price structure. The number of active addresses on XRP has spiked just as the price has and has slowed down as recently as the price conversion to the $3.60 region.
In the past 90 days, the number of addresses expanded at a rate of more than 100%, increasing to exceed 31,700 on average.
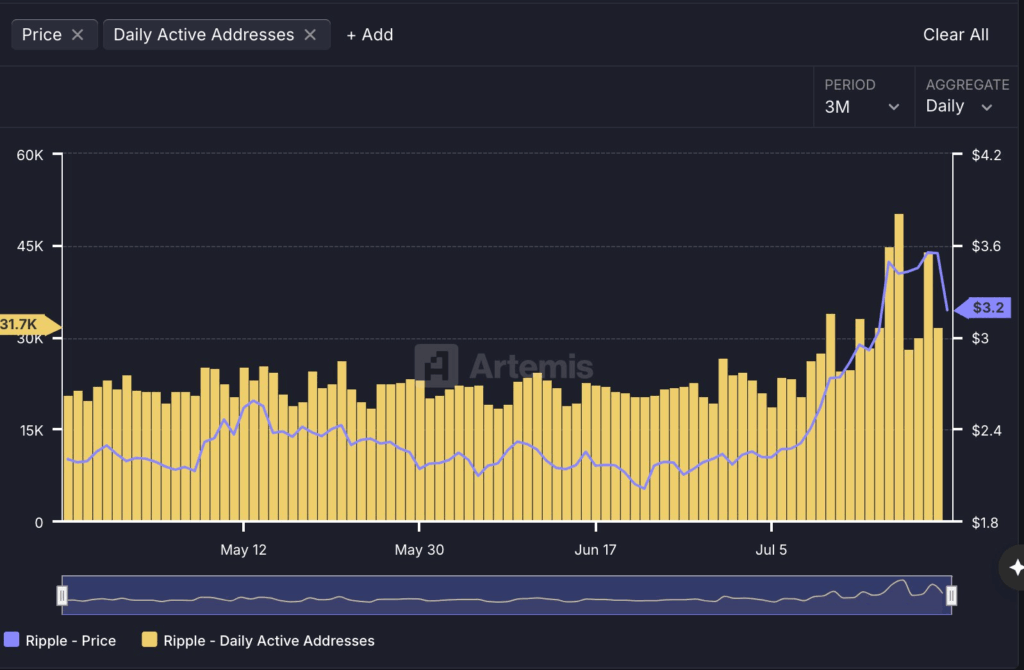
This increase in participation rate indicates that the current XRP price action is being facilitated by real users’ actions rather than short-term speculative activities.
A long-term buildup on the chain will likely validate the market structure’s power. More price increases can follow this if the tendency is maintained.