Zerebro
 Bitcoin
 Pudgy Penguins
 NEAR Protocol
 Quantus
 Pearl
Pearl ZKsync
Key Insights:
- If Ethereum (ETH) price continues trading below the $3,750 level, it could decline by 4.5% to around $3,530, or potentially drop as much as 10% to the $3,300 level.
- ETH price appears to be bearish on the shorter time frame, as it has broken below the key support level of $3,750.
- Data from the SoSoValue reveals 19 consecutive days of inflows for the Ethereum ETF.
Despite persistent inflows into the spot Ethereum ETF (Exchange-Traded Fund), the native token, ETH, appears to be forming a bearish pattern and is poised for a potential price dip. This pattern has emerged after Ethereum (ETH) price lost its key support level at $3,735.
Current Ethereum (ETH) Price Momentum Amid Continuous Inflow
With a 4.10% price decline in the past 24 hours, Ethereum (ETH) failed to hold its key support. It was trading near the $3,685 level at press time.
This breakdown, along with the potential for further price decline, has reduced investor and trader participation. That led to a 5% drop in trading volume over the past 24 hours.
Despite the recent price decline, institutional sentiment for the long term appears to be bullish. On July 31, 2025, a well-followed crypto expert shared a post on X (formerly Twitter), stating that Ethereum ETFs have recorded continuous inflows for 19 consecutive days.
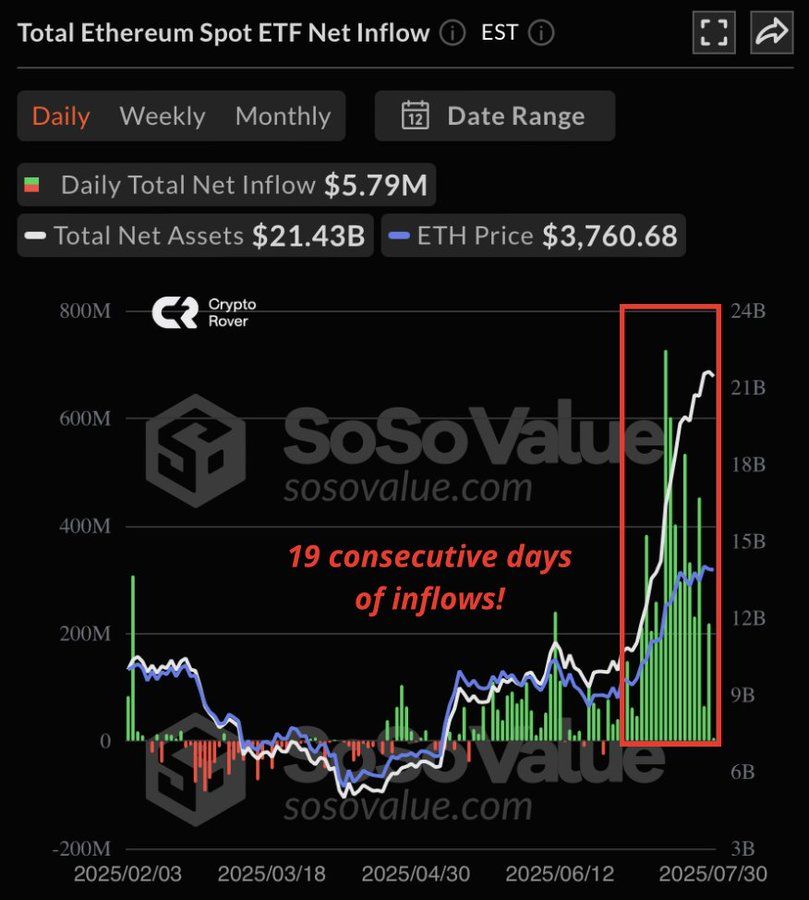
The expert also noted that “nothing stops this train.” Meanwhile, this consistent inflow of ETH signals strong institutional interest and confidence ahead of a potential major rally.
Ethereum (ETH) Price Action and Key Levels to Watch
According to expert technical analysis, ETH appears bearish on the shorter time frame, as it has broken below the key support level of $3,750 and has also breached an ascending triangle pattern. This breakdown has now opened the path for significant downside momentum.
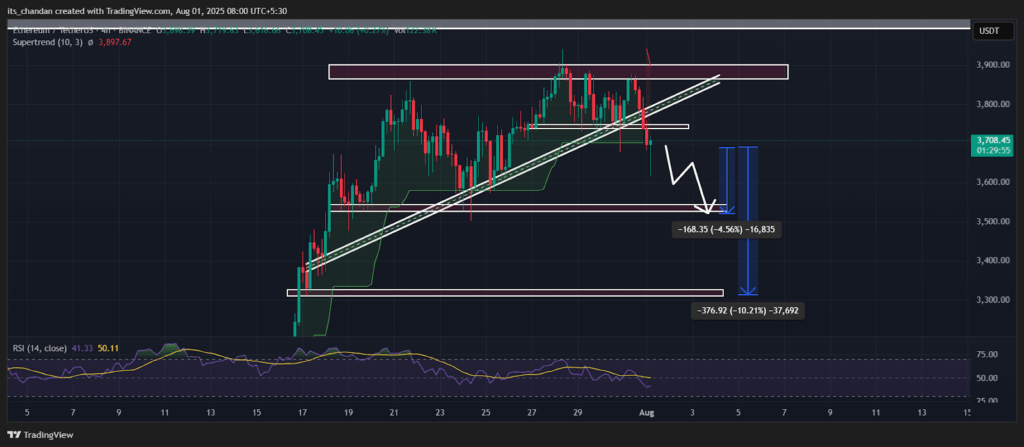
According to the four-hour chart and recent price action, if ETH remained below the $3,750 level, there was a strong possibility of a further decline. It could fall 4.5% down to the $3,530 level and even 10% down to the $3,300 level.
However, this bearish outlook could be reversed only if Ethereum (ETH) could regain the $3,750 level. Otherwise, the short-term bearish trend is likely to continue.
The Supertrend technical indicator was flashing a bearish signal after the breakdown and price decline. That indicated the potential continuation of the downward move until the price turns bullish.
Meanwhile, the Relative Strength Index (RSI) has dropped to 39, indicating weakening momentum and the possibility of further selling pressure.
$77 Million Worth of ETH Outflow
Given the current market sentiment and ongoing price decline, investors and long-term holders appeared to be seizing the dip. That’s because token outflows from exchanges surge.
Data from the on-chain analytics platform CoinGlass revealed that exchanges witnessed an outflow of approximately $76.89 million worth of ETH tokens in just a few hours.
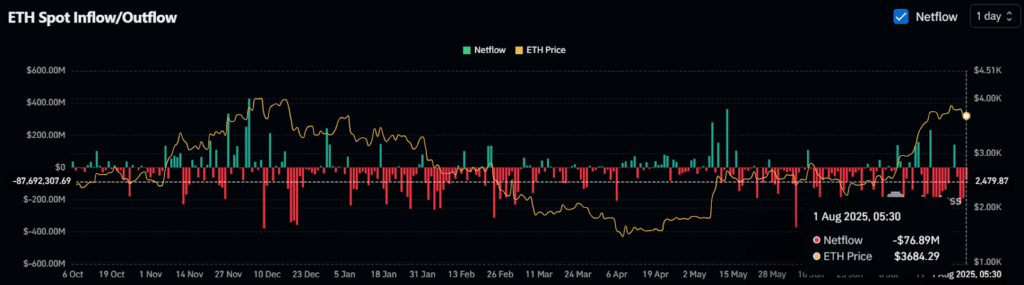
Such a huge outflow after the breakdown could reduce the selling pressure and help reverse market sentiment. Still, a meaningful shift could take place only if ETH crypto price regains the $3,750 level.
Traders Bearish Outlook: $2.70 Billion Worth of Short Bets Spotted
Traders currently appear to be strongly bearish, as short positions are rising significantly, indicating expectations of a further price decline.
According to the Exchange Liquidation Map, major liquidation levels are positioned at $3,588.1 on the downside and $3,898 on the upside, with traders heavily over-leveraged around these levels.
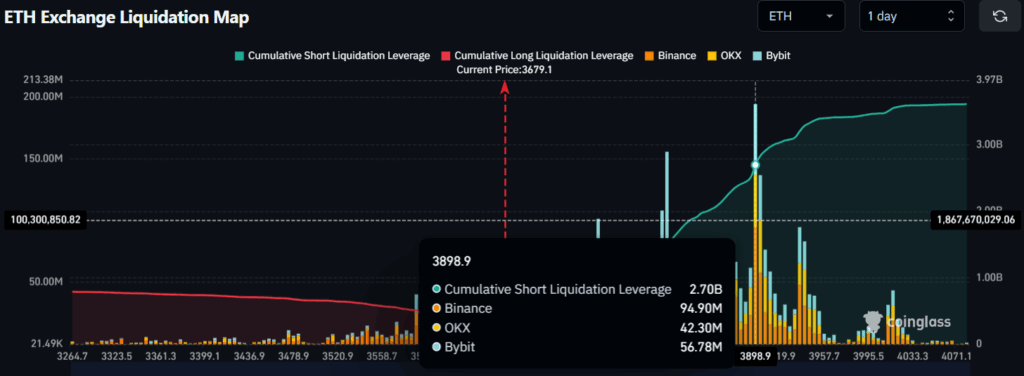
Given the current market sentiment, if the ongoing decline continues and the price falls below $3,588.1, approximately $506.6 million worth of long positions could be liquidated.
Conversely, if sentiment shifts and Ethereum (ETH) price rises above $3,898, around $2.70 billion worth of short positions may be liquidated. Taken together, these on-chain metrics suggest that short-term market sentiment remains bearish, while the long-term outlook is still bullish.
Disclaimer
This article is for informational purposes only and provides no financial, investment, or other advice. The author or any people mentioned in this article are not responsible for any financial loss that may occur from investing in or trading. Please do your research before making any financial decisions.