Universal High Income
 Axis Robotics
 Pudgy Penguins
 Pearl
Pearl Orbio.so
 Quantus
 Lighter
Sei price had a severe decline in September as general markets showed weakness. The token dropped to one of its lowest zones in September amid continuous selling pressures.
Together with the price movement, Sei declared a new partnership with Apollo. It’s an international asset manager with assets under management (AUM) of $840 Billion.
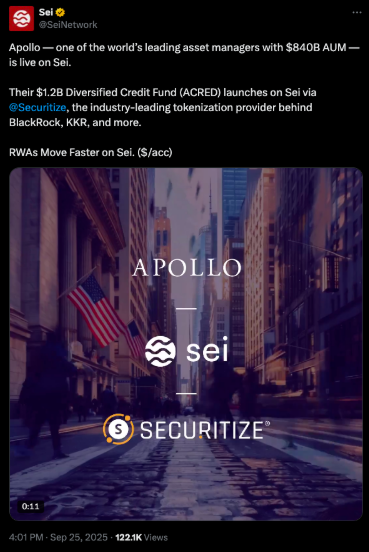
Apollo has a $1.2 Billion Diversified Credit Fund (ACRED) that has officially been published on Sei via Securitize.
It’s a tokenization firm that has helped institutions like BlackRock and KKR with digital asset projects. While Sei is under pressure, this integration could provide a narrative offset to the recent losses.
Sei Price in a Major Support Zone
The Sei price severely declined on September 25, dropping by 3.5% in a day. The token dropped to $0.27, one of its lowest in September, following the continuous selling pressures.
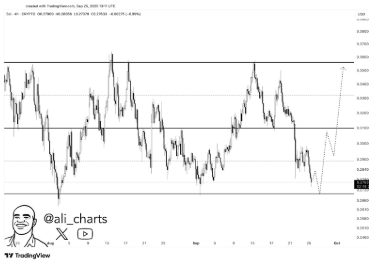
SEI started the day with a price of $0.2806 and ended with a price of $0.2763 on the 4-hour time scale. This shows that it has declined by 0.99% intraday.
The charts show a crucial support level at $0.27. The conclusive hold may determine the future movement. Defending this zone would allow SEI to resume a rebound to $0.34.
A drop below $0.27 could increase risk for SEI. The trend shows weakening momentum. The next visible support lies at $0.25.
Sei Under Intense Demand
The daily chart supports this point of view. The trendline since July shows limited upward movement. Price action remains under control despite minor rallies.
Horizontal support has formed between $0.25 and $0.27. Blue circles mark accumulation zones in the chart. The current price is one step higher than that of this cluster. This puts much importance on the Sei price action in the near future.
The level of trading has been mostly the same. However, distribution pointers indicate that profit-taking has intensified as SEI has been nearing the area of $0.35 to $0.36.
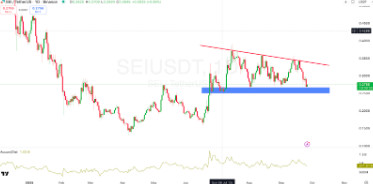
The Accumulation/Distribution (A/D) line has been falling since August. Its current value stands at 871.81 million. This is a sharp drop from last year’s 1.5 billion. This is an indication that there is demand, but continuous selling pressure has inhibited the sustainability of breakouts.
The short-term concern about the SEI price is whether it can keep its support above $0.27. That is why holding this line would save its range. This could also open the way to a short-term rebound, according to the technical forecast of $0.34.
Loss of control may fuel the downward trend. The next significant level will be at $0.25. The addition of Apollo as an institution underscores Sei’s strategic focus on tokenizing real-world assets.
This can improve the long-term fundamentals. However, short-term action still depends on market sentiment and essential price levels.