Quack AI
 Pudgy Penguins
 Starknet
 Pearl
Pearl Sui
Sui Celestia
 Quantus

The XRP price is facing difficulty in testing a key resistance level after rebounding from mid-October lows. Experts warn that conflicting signals have emerged in the indicators as buyers try to maintain momentum above $2.60. Whether the token closes above $2.70 will determine its near-term trend.
XRP Price Facing TD Sequential Sell Signal
The TD Sequential indicator on the daily chart has issued a sell signal after a 14% recovery from $2.36. Analyst Ali revealed that this indicator has been able to spot all XRP trend reversals over the last 3 months.
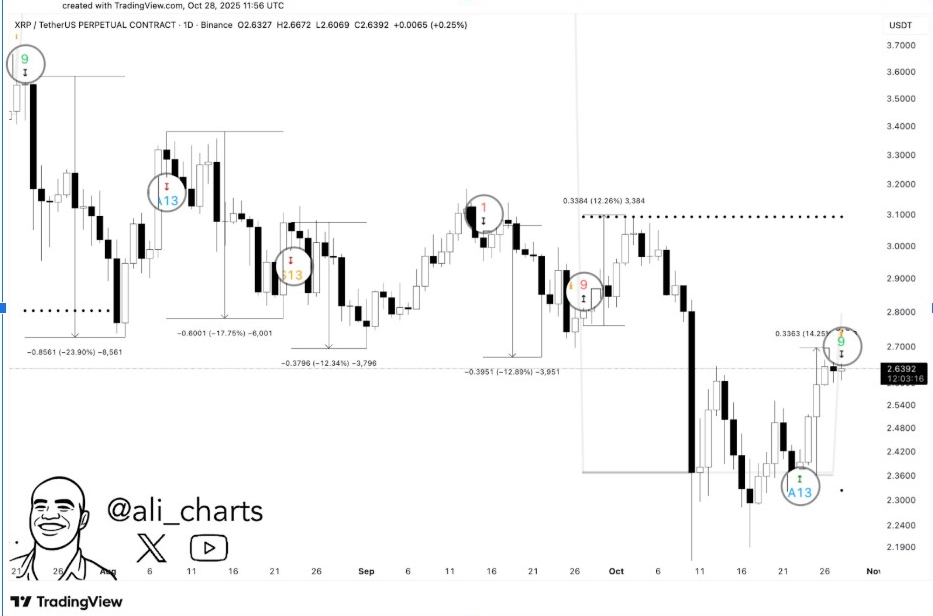
Historically, previous TD9 signals have coincided with local highs and have been followed by pullbacks averaging from 12% to 20%. The same setup has now appeared again near $2.70. The XRP price is trading near $2.63, approaching a key resistance zone. If this signal repeats its past accuracy, then the token could see a temporary pause or retracement.
The TD Sequential counts nine consecutive candles in one direction, and this is often the point where a trend is exhausted. In the last few months, every “9” count has been followed by critical corrective phases. If history is repeating itself, then the signal could impact the momentum of XRP prior to buyers making an attempt to breakout.
Resistance at $2.65–$2.70 Remains a Crucial Breakout Zone
EGRAG CRYPTO observed that XRP was rebounding strongly off the $2.60 support zone, and that a clear retest of liquidity was being formed around $2.70. This is the area indicated in the chart to identify as the main decision point for both short-term and medium-term traders.
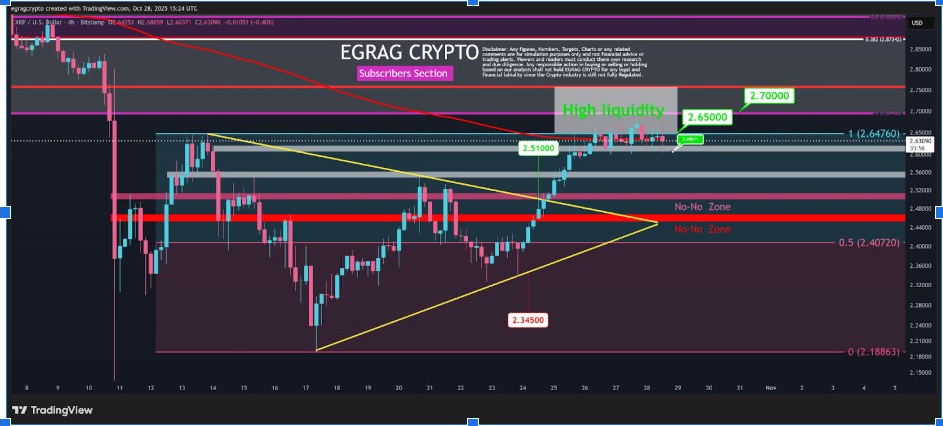
A confirmed close above $2.70 could open up the door to $3.00. Failure to break higher – return price action towards $2.50 or even $2.44. The setup also revealed several “no-no zones” below $2.48, where liquidity remains thin. These levels are risk areas for long positions if the current rally weakens.
EGRAG’s macro chart displays XRP consolidating within a long-term bullish pennant structure, which started forming in 2018. This is a pattern indicating a tightening of price action before a breakout. The analyst believes that as long as the pattern remains intact, the long-term outlook of XRP remains positive. A breakout could see the token rise extremely high above $3 upon confirmation.
Elliott Wave Structure Points to Possible Fifth Wave Drop
Furthermore, analyst CasiTrades noted that XRP’s recent move aligns with an Elliott Wave correction that is expected to be completed in the near future. The price structure indicates a possible wave four test at the Fibonacci 0.786 level at $2.68.
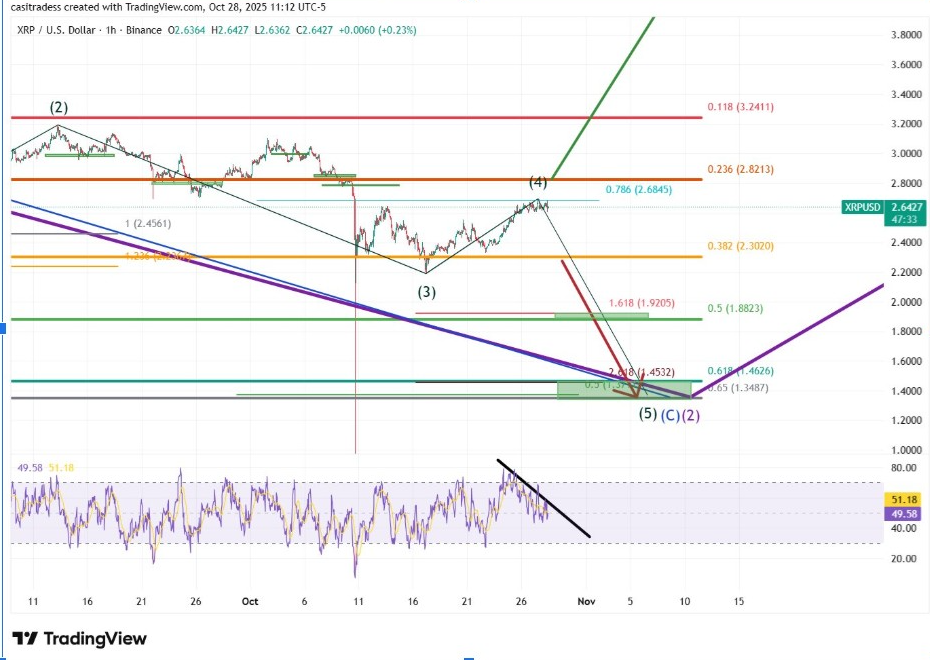
If the resistance holds, a final wave five may play out to $1.90 or even $1.45. This projection coincides with the 1.618 Fibonacci extension. The RSI trendline has also begun to slope down, indicating weakening momentum as the market nears resistance.
However, a breakout above $2.70, which is sustained, could invalidate the bearish setup. In that case, XRP price could enter into an impulsive wave higher. Traders are paying close attention to both Fibonacci levels and RSI behavior for early indications of potential market movements.
On-Balance Volume Suggests Strength but Warns of Caution
Data shared by IncomeSharks revealed that XRP’s on-balance volume (OBV) remains within an ascending channel. This indicates accumulation among long-term holders, even when prices fall.
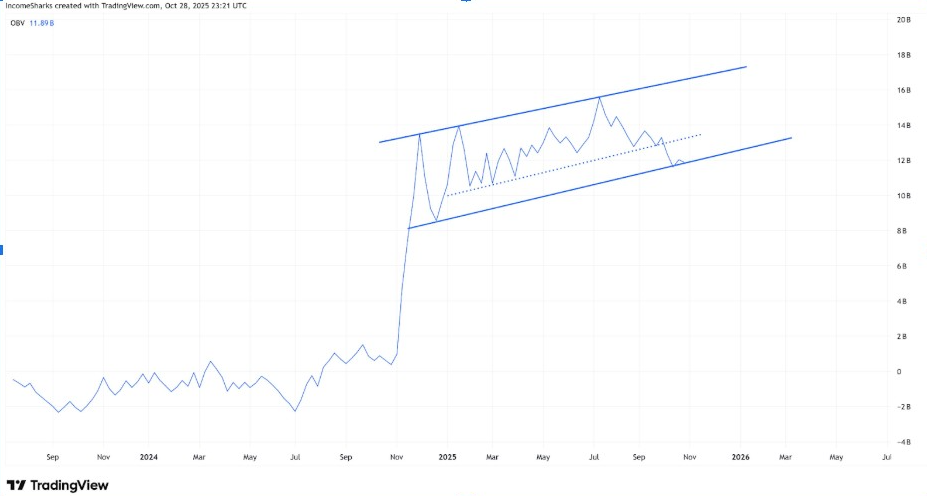
OBV currently tests the lower boundary of this channel, representing a key support level for bullish sentiment. If this trendline breaks, selling pressure could increase strongly. The analyst commented that XRP still appears stronger than many of the major altcoins but “flirts with danger” if the volume trend weakens.
A breakdown in OBV could coincide with a decline in price under $2.50. Conversely, a bounce off the current support would indicate renewed accumulation and validate the bullish pennant structure as mentioned by EGRAG. Traders are therefore keeping an eye on both metrics in order to gauge overall sentiment.