Wisp
Wisp Doge Pepe
 Zylo Ecosystem
 Crawlerpad
 Pearl
Pearl Starknet
 NEAR Protocol

Dogecoin price is exhibiting a strong bullish structure, as several analysts have noted a cyclic pattern.
Technical formations suggest a possible double bottom and breakout pattern. It’s similar to the explosive rally in 2021. Based on the charts, the DOGE price may be entering a new long-term bull market phase.
Dogecoin Price Forms Double Bottom, Eyeing Strong Upside
Analyst Trader Tardigrade noted the formation of a clear double bottom pattern in the Dogecoin price on the three-day chart. The setup is similar to those previous patterns that preceded major rallies in prior bull markets.
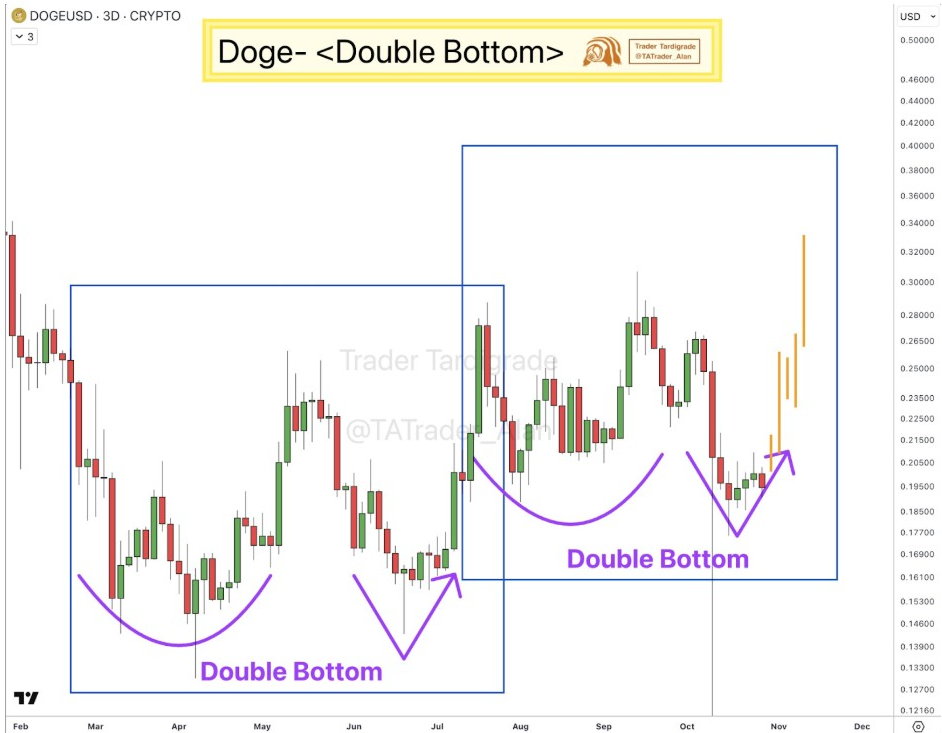
DOGE price rebounded from a similar floor near $0.17. This helped form a symmetrical recovery base. Based on the analysis, this double bottom could serve as the basis for a breakout candle. This signals a move towards $0.30 or higher.
Momentum indicators are also turning positive. This indicates that buyers are gaining strength after months of accumulation. A strong close above the neckline may lead to rapid momentum expansion. That’s similar to previous breakouts observed in 2021.
Dogecoin Price Repeats Multi-Year Structure in Long-Term Chart
Trader Tardigrade shared another post about Dogecoin. He compared the current setup to a past cycle. The analysis focused on the two-month chart pattern. The analyst argued that the Dogeccoin price is in the same accumulation-to-breakout pattern that resulted in its 2021 rally.
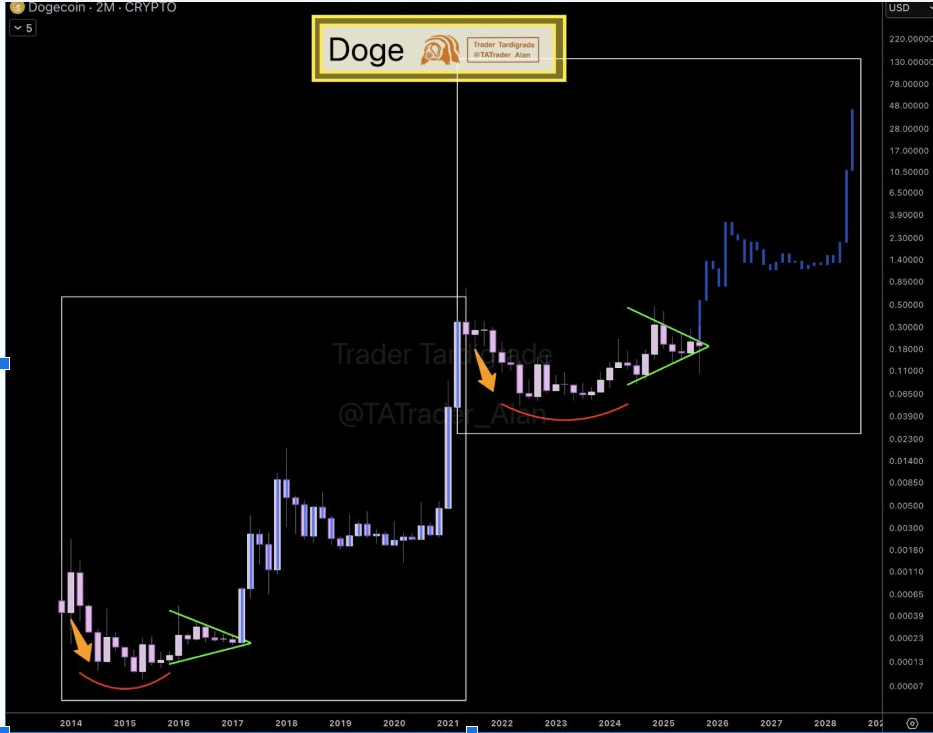
This pattern included a long consolidation, a narrowing wedge, and an expected upward breakout. This fractal suggests that the DOGE price may continue its past performance. This aligned with an overall recovery in the cryptocurrency market.
Tardigrade’s historic comparison depicts the same triangular compressions that precede every major uptrend. If history repeats itself, the current consolidation can come to an end with yet another big rally.
In this case, Dogecoin price, trading at around $0.19, could move towards targets between $0.45 and $0.75.
Momentum Builds as DOGE Price Holds Key Support Zone
Furthermore, Analyst EtherNasyonal also supported this bull narrative by pointing out DOGE’s steady channel structure throughout various bull waves.
The monthly chart showed DOGE following the same ascending parallel channel through each expansion period in the past.
According to the analysis, the top memecoin is in its third major bull wave. The asset has been placed near the lower side of the long-term channel where previous breakouts have occurred.
The structure suggests that momentum is silently building up above significant support around $0.18.
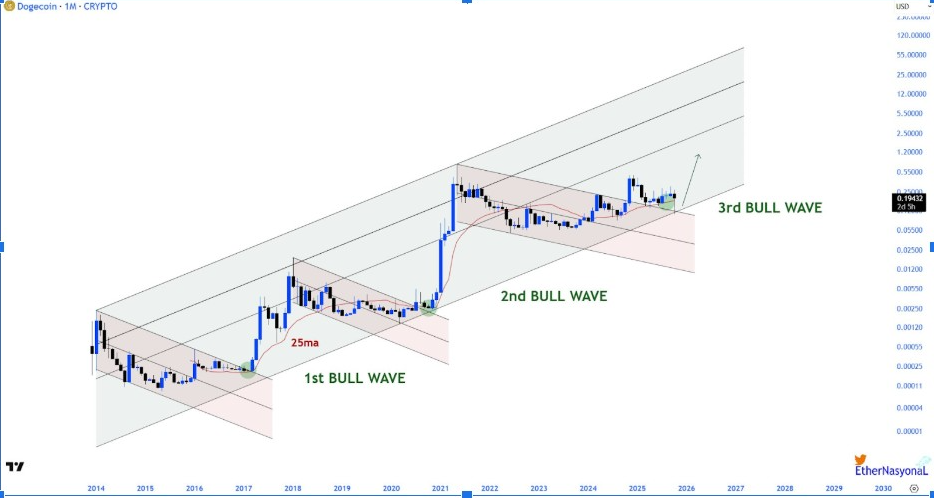
The analyst observed that the Dogecoin price tends to surge after periods of accumulation. Once resistance breaks, the price often moves rapidly and exponentially. As long as price action stays within the structural range, the uptrend is valid.
Dogecoin’s Final Bull Wave Could Start in November
Meanwhile, Crypto analyst GalaxyBTC also shared similar optimism. This highlights that Dogecoin’s cyclical structure bears many similarities to the one seen ahead of its 2020 rally. His chart has parallel resistance and support lines converging to a breakout zone for early November.
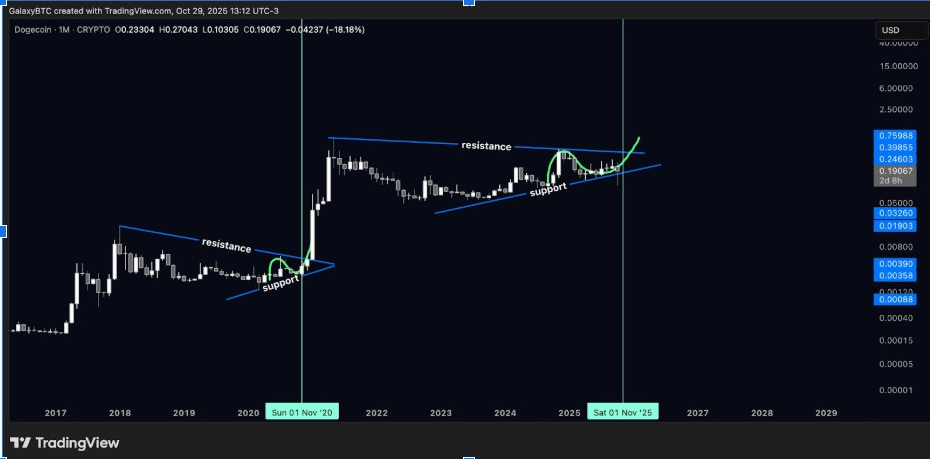
DOGE may be nearing the end of its compression phase. Historical cycle patterns suggest a breakout could happen in the same month as before.
GalaxyBTC said, “November may be the month Dogecoin starts barking,” citing symmetry in the pattern with the 2020 breakout. If confirmed, a breakout above the $0.25 resistance line may signal the beginning of Dogecoin’s next bullish expansion phase.