Bitcoin
 Starknet
 Pearl
Pearl ZKsync
 NEAR Protocol
 Quantus
 Zerebro

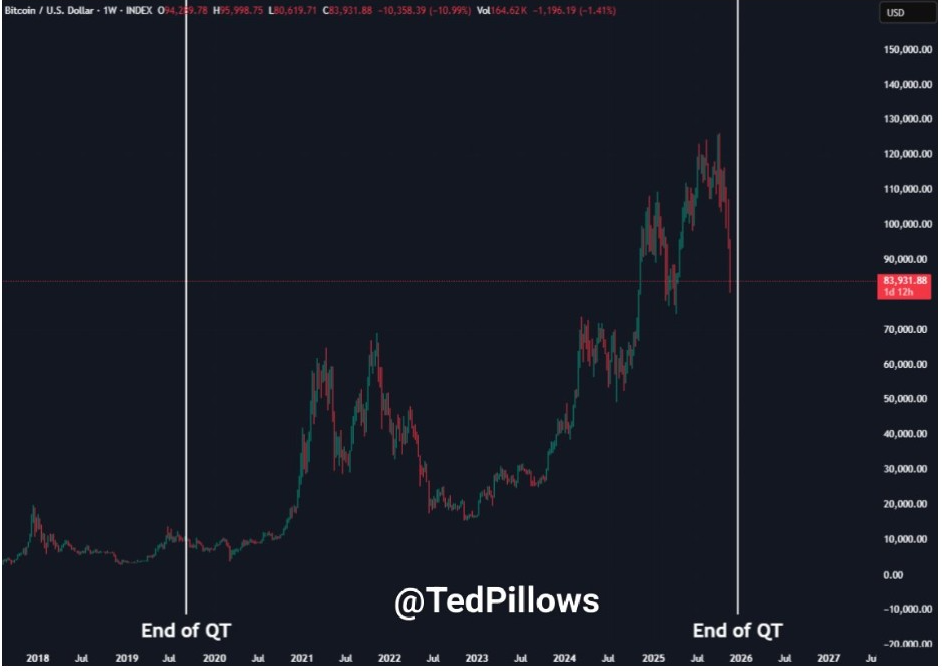
Bitcoin price is still losing momentum as the market pressure continues to grow across various indicators. ETF withdrawals remain unusually high. The Fed is set to end quantitative tightening in nine days.
Traders now eye the important $77,000 support area. It is one of the largest clusters of accumulation in the cycle.
ETF Outflows Push Bitcoin Price to a Major Support Zone
US spot Bitcoin ETFs continue to record extreme outflows. Over $3.79 billion in these products were left in November, a new monthly record. This withdrawal streak has weakened the sentiment across the market. Liquidity is still thin, and downside moves can be accelerated.
BTC price is now close to the heavy cost basis cluster around $77,000. On-chain data indicates that many wallets accumulated supply in this zone throughout previous rallies.
This region has performed as a strong platform in the past retracements. Traders anticipate this cluster to have an effect on Bitcoin price trends as the pressure builds.
Kiyosaki’s Sale Adds Weight
Robert Kiyosaki confirmed he sold 2.25 million worth of Bitcoin at $90,000. He initially purchased those coins for $6,000, realizing a gain of nearly 1,400%.
His move highlighted the latest wave of profit-taking from long-term holders. Many wallets have started to distribute the supply as the volatility increases.
This selling trend occurs amid a challenging market for the broader economy. Increased supply hitting major exchange places added downward stress. Some older wallets moved for the first time in months.
These trends can often be seen when traders anticipate a deeper retracement. Investors are now watching to see if this pressure eases as the week progresses.
On-Chain Heatmaps Show $77K as a Heavy Bitcoin Price Support
Glassnode’s cost basis heatmap highlighted the $77,000 region. It marked one of the cycle’s strongest buyer zones. Analysts said this level is crucial for BTC price support. About 171,617 BTC were accumulated around this level.
According to Ali, this creates a thick supply band with considerable weight on the chain. Such clusters often serve as stabilizers during heavy corrective moves.
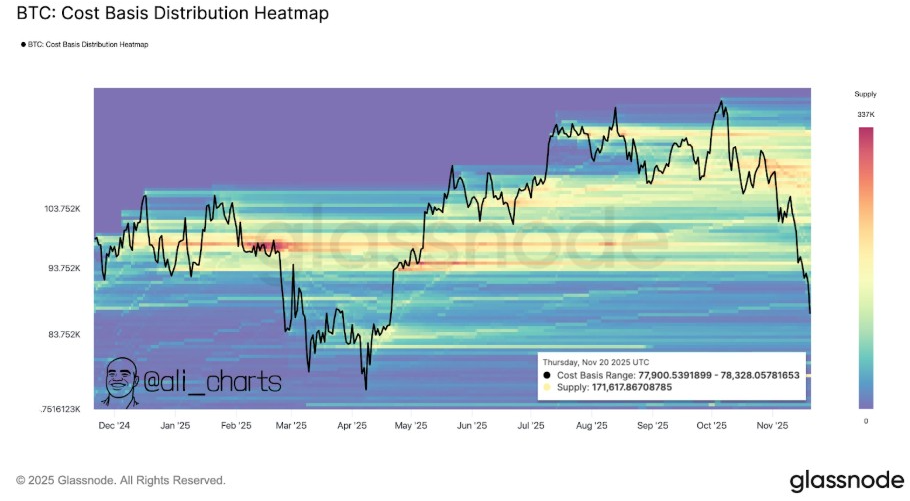
Bitcoin price now trades directly above this accumulation shelf. If this zone holds, a quicker return to control of buyers could happen.
However, if it fails, price discovery may move towards the low $70,000s. That is a region with lighter support. Traders are still concerned with how the market is reacting as the cluster is stressed.
Trendline Retest and Fed’s QT Timing Match Analyst Models
The weekly chart showed the BTC price coming to the lower boundary of the long-term ascending structure. This trendline has been the guiding trendline for each major rally since early 2023.
Price rejected the midline a few times during this year, resulting in the current retest. The weekly RSI is also approaching oversold territory.
Ted Pillows pointed out that the Fed will end QT in nine days. His chart indicated that the preceding QT interval ended just before an even greater Bitcoin price decline.
He warned that macro timing could have an impact on near-term volatility. This comment adds weight since the price touches an important structural level.
Analyst Gert van Lagen saw similar dynamics in the long term. He pointed out the fact that the top cryptocurrency is on the key 0.382 retracement zone used in previous cycles. Every halving phase has had similar midline rejects followed by trendline retraces.
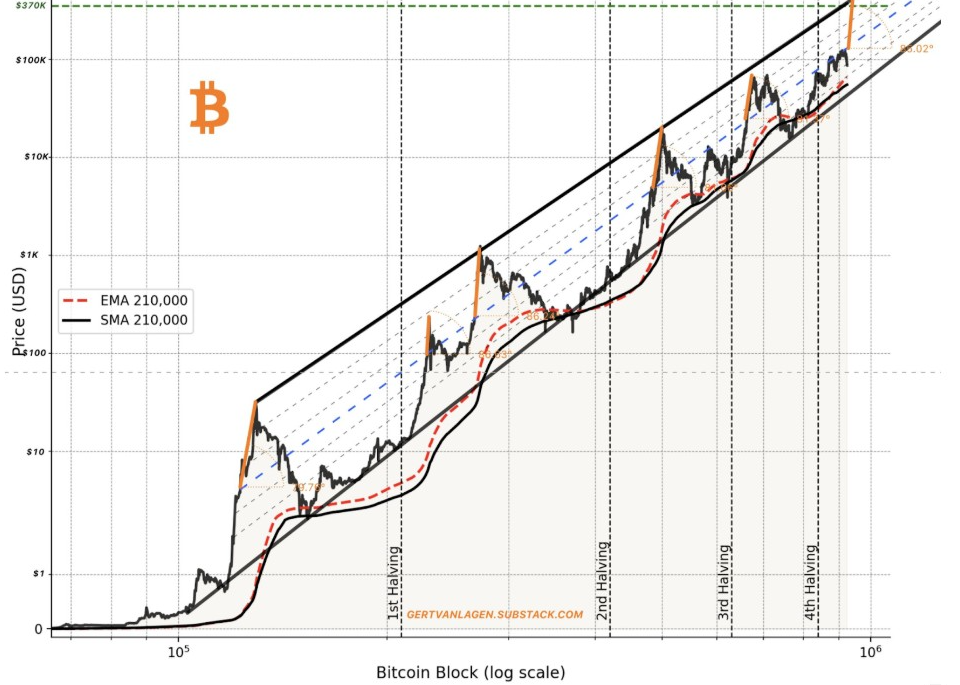
His model pointed to the possibility of a move towards $350,000-$400,000 if this structure holds. BTC price is now interacting with both technical and macro turning points.