
 Puffer
 ZKsync
 Pearl
Pearl Bitcoin
 Ondo
Ondo Walrus
 Pudgy Penguins

Hyperliquid (HYPE) price is under pressure again after slipping into the mid-20s. On-chain watchers report that Hyperliquid’s largest tracked long is actively defending margin as volatility builds. At the same time, traders are considering the bearish triangle break versus the buyback story of the platform.
Hyperliquid Crypto Whale Margin Defense Puts $23.91 Liquidation Level in Focus
Lookonchain flagged a wallet at 0x082e, described as the largest HYPE bull, after it added fresh collateral. The address contains a 1.38 million HYPE perpetual long on Hyperliquid at 5x cross leverage, and the position snapshot shows the trade deep underwater as HYPE price is trading far below the entry region.
Instead of closing, the trader reportedly deposited another $2.4 million in USDC in multiple tranches to strengthen margin. That move lowered the liquidation price to $23.91, which is now functioning like a near-term trigger for the wider market because any forced unwind could introduce sudden sell pressure in the face of thin liquidity.
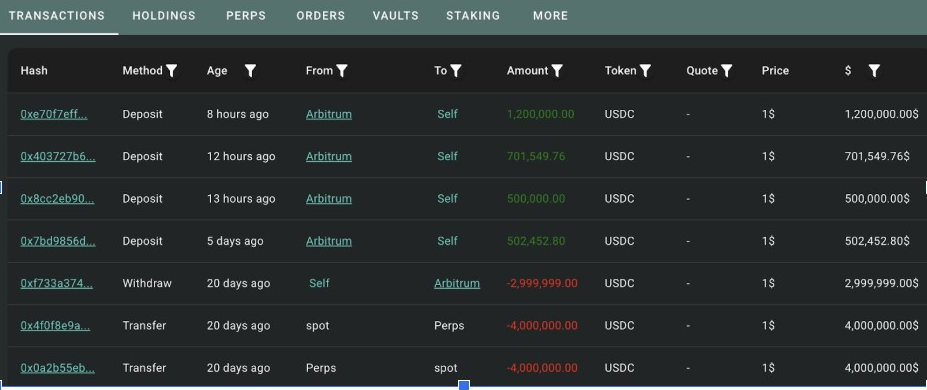
The positioning is important as it creates a visible “line in the sand” for sentiment. If HYPE price holds above that zone, it can reduce liquidation risk and calm the tape. However, if price dips into the low $20s, the market could see cascading pressure as other leveraged longs rush to de-risk.
Hyperliquid Crypto Triangle Breakdown
While whales defend the margin, the chart picture is fragile. Ali Charts pointed to a 4-hour triangle breakdown, putting $20 as the technical target of the breakdown pattern from the measured move. With the price already lower than the previous structure, the setup implies sellers still maintain the direction unless Hyperliquid crypto price can recover key breakdown levels.
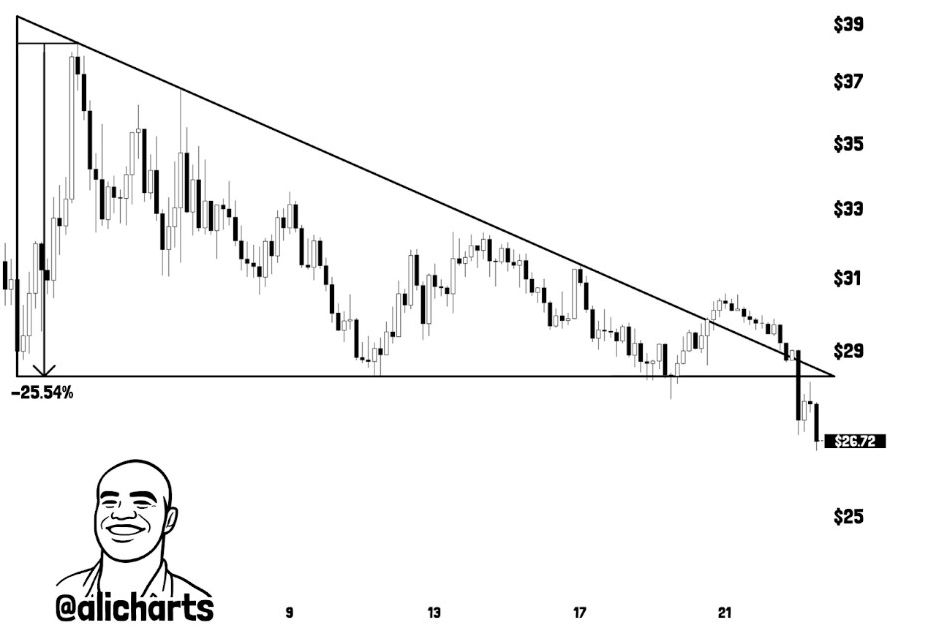
In this context, the $29 area is important as it switches from support to overhead resistance. An absolute clean reclaim and hold above that area would weaken the breakdown thesis and indicate that buyers are taking back control. Until that occurs, short covering rallies may find it difficult to extend, particularly if they are not supported by volume follow-through.
The risk is not only in one direction but also speed-related. Leverage can amplify both sides, so a short bounce can look good and still fail in hours. That is why traders are watching to see if HYPE price will be able to stabilize and form higher lows before calling a durable reversal.
Fee Spike Revives Buyback Narrative
Even with price softness, Hyperliquid’s fee profile is giving bulls something to point at. Peggy.h shared a 24 hour fees number of about $1.71 million, which implies that the platform is still making some meaningful revenue during the drawdown. Community discussion argues that those fees support open-market buybacks and token burns, reducing circulating supply over time.
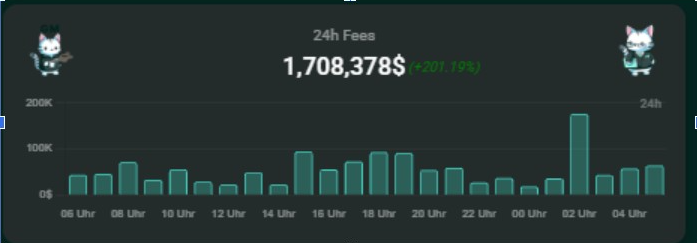
However, buybacks tend to matter most after the panic selling cools off. During liquidation-driven moves, systematic demand can be overwhelmed by forced sales and thin order books. Still, as HYPE price drops, more tokens can be retired per bought-back dollar, which is why supporters have seen lower prices as mechanically improving the burn effect.
This creates a tug of war between the short-term structure and the long-term token economics. If trading activity is still elevated, fee-based demand may become a stabilizer. If volumes drain while price breaks support, the buyback story loses its urgency, and bears regain the upper hand.
Analyst Eye $15-$20 Demand Zone as Next Support
Trader, craigscoinpurse said he was a buyer in the $15-$20 area, which coincides with deeper Fib support on his chart. This is important as it corresponds to the same $20 area marked by the triangle target and creates confluence, which tends to attract bids and short profit taking.
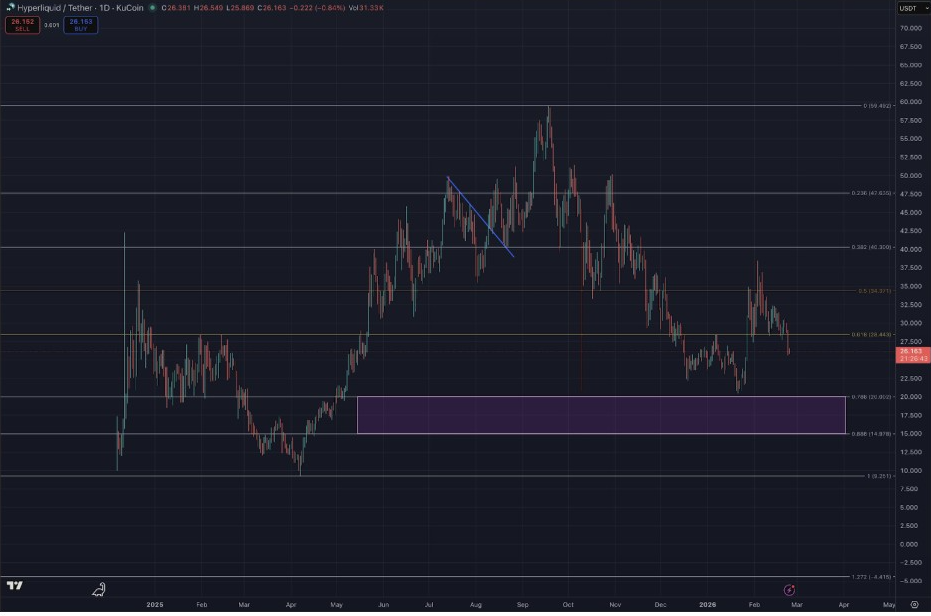
Before any deeper dip, the market is likely to judge HYPE price on whether it can reclaim the mid-range. A move back above the $28-$29 area would be positive for structure and lessen the immediate liquidation overhang. From there, the next challenge is the $34 region, where previous pivots and retracement resistance could be used to cap a rebound.


