Pearl
Pearl ZKsync
 Bitcoin
 Starknet
 Quantus
 Puffer
 Lighter
Chainlink price continued trading near the lower end of its multi-year range as buyers defended support around $7.30. Although LINK remains well below previous cycle highs, several analysts said the token is still trading inside a long-term accumulation structure rather than a confirmed downtrend.
The near-term focus remains on whether LINK can reclaim resistance above $8.20 and eventually move back above $10.87, a level several analysts identified as the first major confirmation of a broader recovery.
Chainlink Price Holds Long-Term Accumulation Zone
Chainlink price is trading close to $8 after another period of sideways movement inside a wide multi-year structure. Crypto Patel’s chart places LINK inside an accumulation zone between $8 and $5, with the current price still above the lower invalidation area.
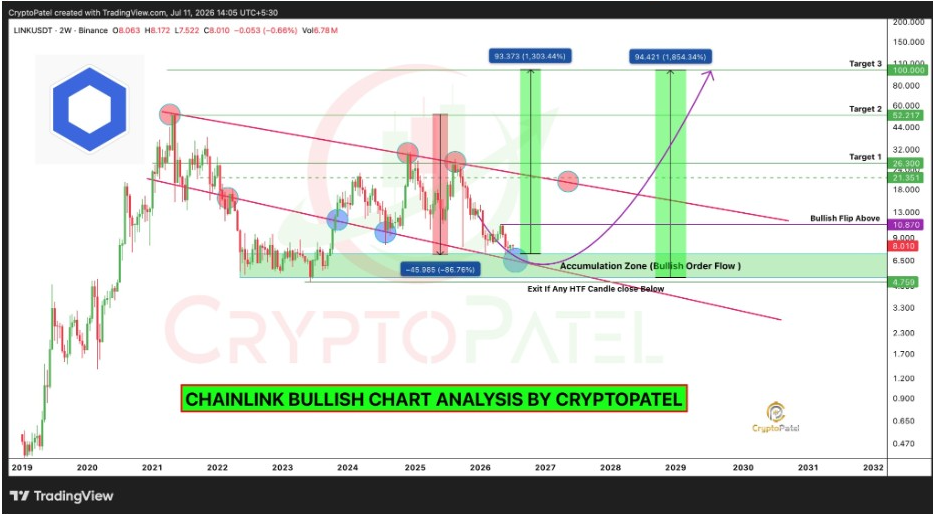
The chart showed LINK price moving near the bottom of a descending long-term channel. That region has acted as a reaction zone several times since 2022, with price repeatedly bouncing from the broader demand area.
Crypto Patel marked $4.759 as the deeper line to watch if higher-timeframe weakness returns. A candle close below that level would damage the long-term setup and weaken the accumulation thesis.
LINK crypto remains above that support. The token also sits below the “bullish flip” level near $10.87, which means buyers still need confirmation before the structure shifts from accumulation to expansion.
A reclaim of $10.87 would place LINK back above a major chart boundary. That move could invite stronger momentum from traders who have stayed cautious during the long drawdown.
Analyst Maps $50 to $100 LINK Crypto Targets
Meanwhile, Crypto Patel’s long-term Chainlink chart places the first major upside target near $26.30. The second target stands around $52.21, while the third long-term target sits at $100.
Those levels come from a broader bullish recovery structure marked on the two-week chart. The projection shows a possible move from the accumulation range toward the upper green target band if LINK breaks out of its multi-year downtrend.
The same chart also shows two large upside projections. One measures roughly 1,303% toward the $93 area, while another stretches above 1,850% toward the $94–$100 zone.
Patel also linked the setup to institutional accumulation through U.S. spot LINK ETFs. According to the shared post, institutions have accumulated more than $125 million worth of LINK through those products over eight months.
That narrative strengthens the long-term case, but price still needs to confirm it. LINK must first reclaim $10.87, then challenge $21.35 and $26.30 before the $50–$100 zone becomes a cleaner market target.
LINK Crypto Bulls Watch $8.20 and $10
Additionally, CryptoWZRD said LINK and LINKBTC closed bullish on the daily chart, suggesting further upside could develop from the current range. The analyst said LINKBTC may lead the move if it breaks out of its daily widening wedge formation.
Additionally, CryptoWZRD placed nearby Chainlink price support around $7.30. The short-term resistance sits at $8.20, and a move above that level could open a long setup toward higher intraday levels.
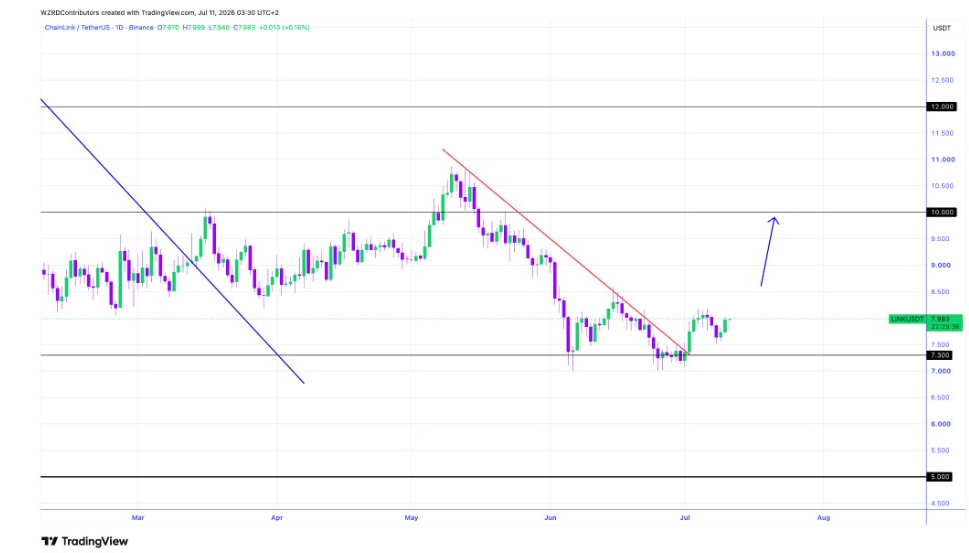
His Chainlink price prediction also pointed to $10 as the next major resistance after $8.20. That zone lines up with the broader recovery map, where LINK needs to reclaim double digits before momentum improves.
A short-term dip is still possible. CryptoWZRD said a move toward $7.65 could offer another long entry if buyers defend the support area.
The current structure therefore, gives bulls a clear checklist. Hold $7.30, reclaim $8.20, then push toward $10. A failure below $7.30 would delay the breakout attempt and bring the lower accumulation range back into focus.
Higher Low Keeps Recovery Attempt Intact
Jesse Olson also highlighted improving price structure on the daily chart.
According to Olson, LINK recently formed a higher low after rebounding from support created by his trend indicator. The move followed a breakout above a descending trendline, suggesting selling pressure has eased.
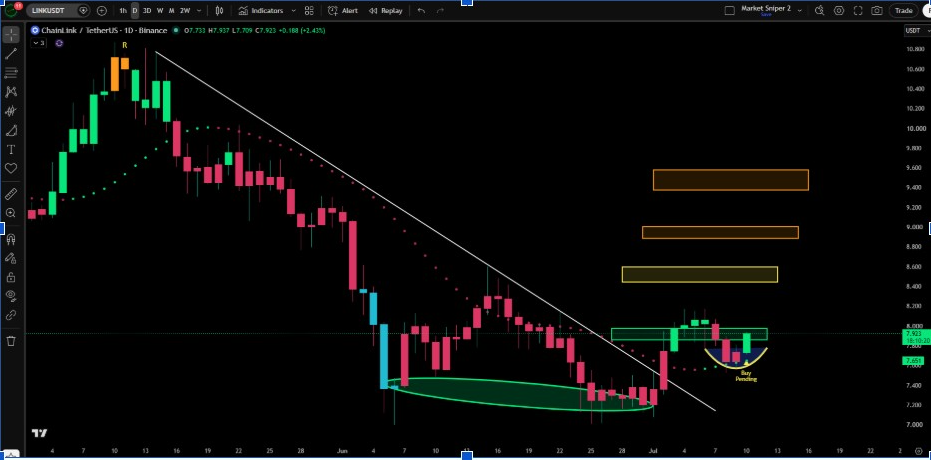
Olson said a daily close above his first target would increase the probability of a broader advance.
His chart identifies resistance through the mid-$8 range before additional supply appears near $9, $9.50 and the key $10.87 level.
As long as LINK continues printing higher lows and maintains support above $7.30, the recovery attempt remains technically intact. A confirmed move above $8.20 would strengthen the case for another test of the psychologically important $10 level.