Claudia
 Crawlerpad
 Bunker Mode
 Starknet
 Pearl
Pearl Quantus
 Pudgy Penguins

Bitcoin (BTC) price continues to face strong rejection at $65,000 while Bitcoin ETFs are once again seeing renewed outflows. Market experts have spotted a short-sell setup for BTC for the month of August. On Friday, July 31, spot Bitcoin ETFs saw cumulative outflows of $265 million.
Spot Bitcoin ETFs Record $265.38 Million in Net Outflows
Spot Bitcoin ETFs ended the month of July 2026 with $265 million in outflows on July 31. Some of the top US-listed firms clocked major outflows amid strong investor withdrawals.
BlackRock’s iShares Bitcoin Trust (IBIT) led the outflows with $122.66 million, equivalent to approximately 1,948 BTC. Moreover, IBIT’s trading volume on Friday was $2.0 billion, as per data from Farside Investors.
At the same time, Fidelity’s FBTC recorded $54.78 million in net outflows, followed by Grayscale’s GBTC with $52.63 million. Similarly, Bitwise’s BITB saw $17.77 million and ARK 21Shares’ ARKB saw $17.54 million in outflows.
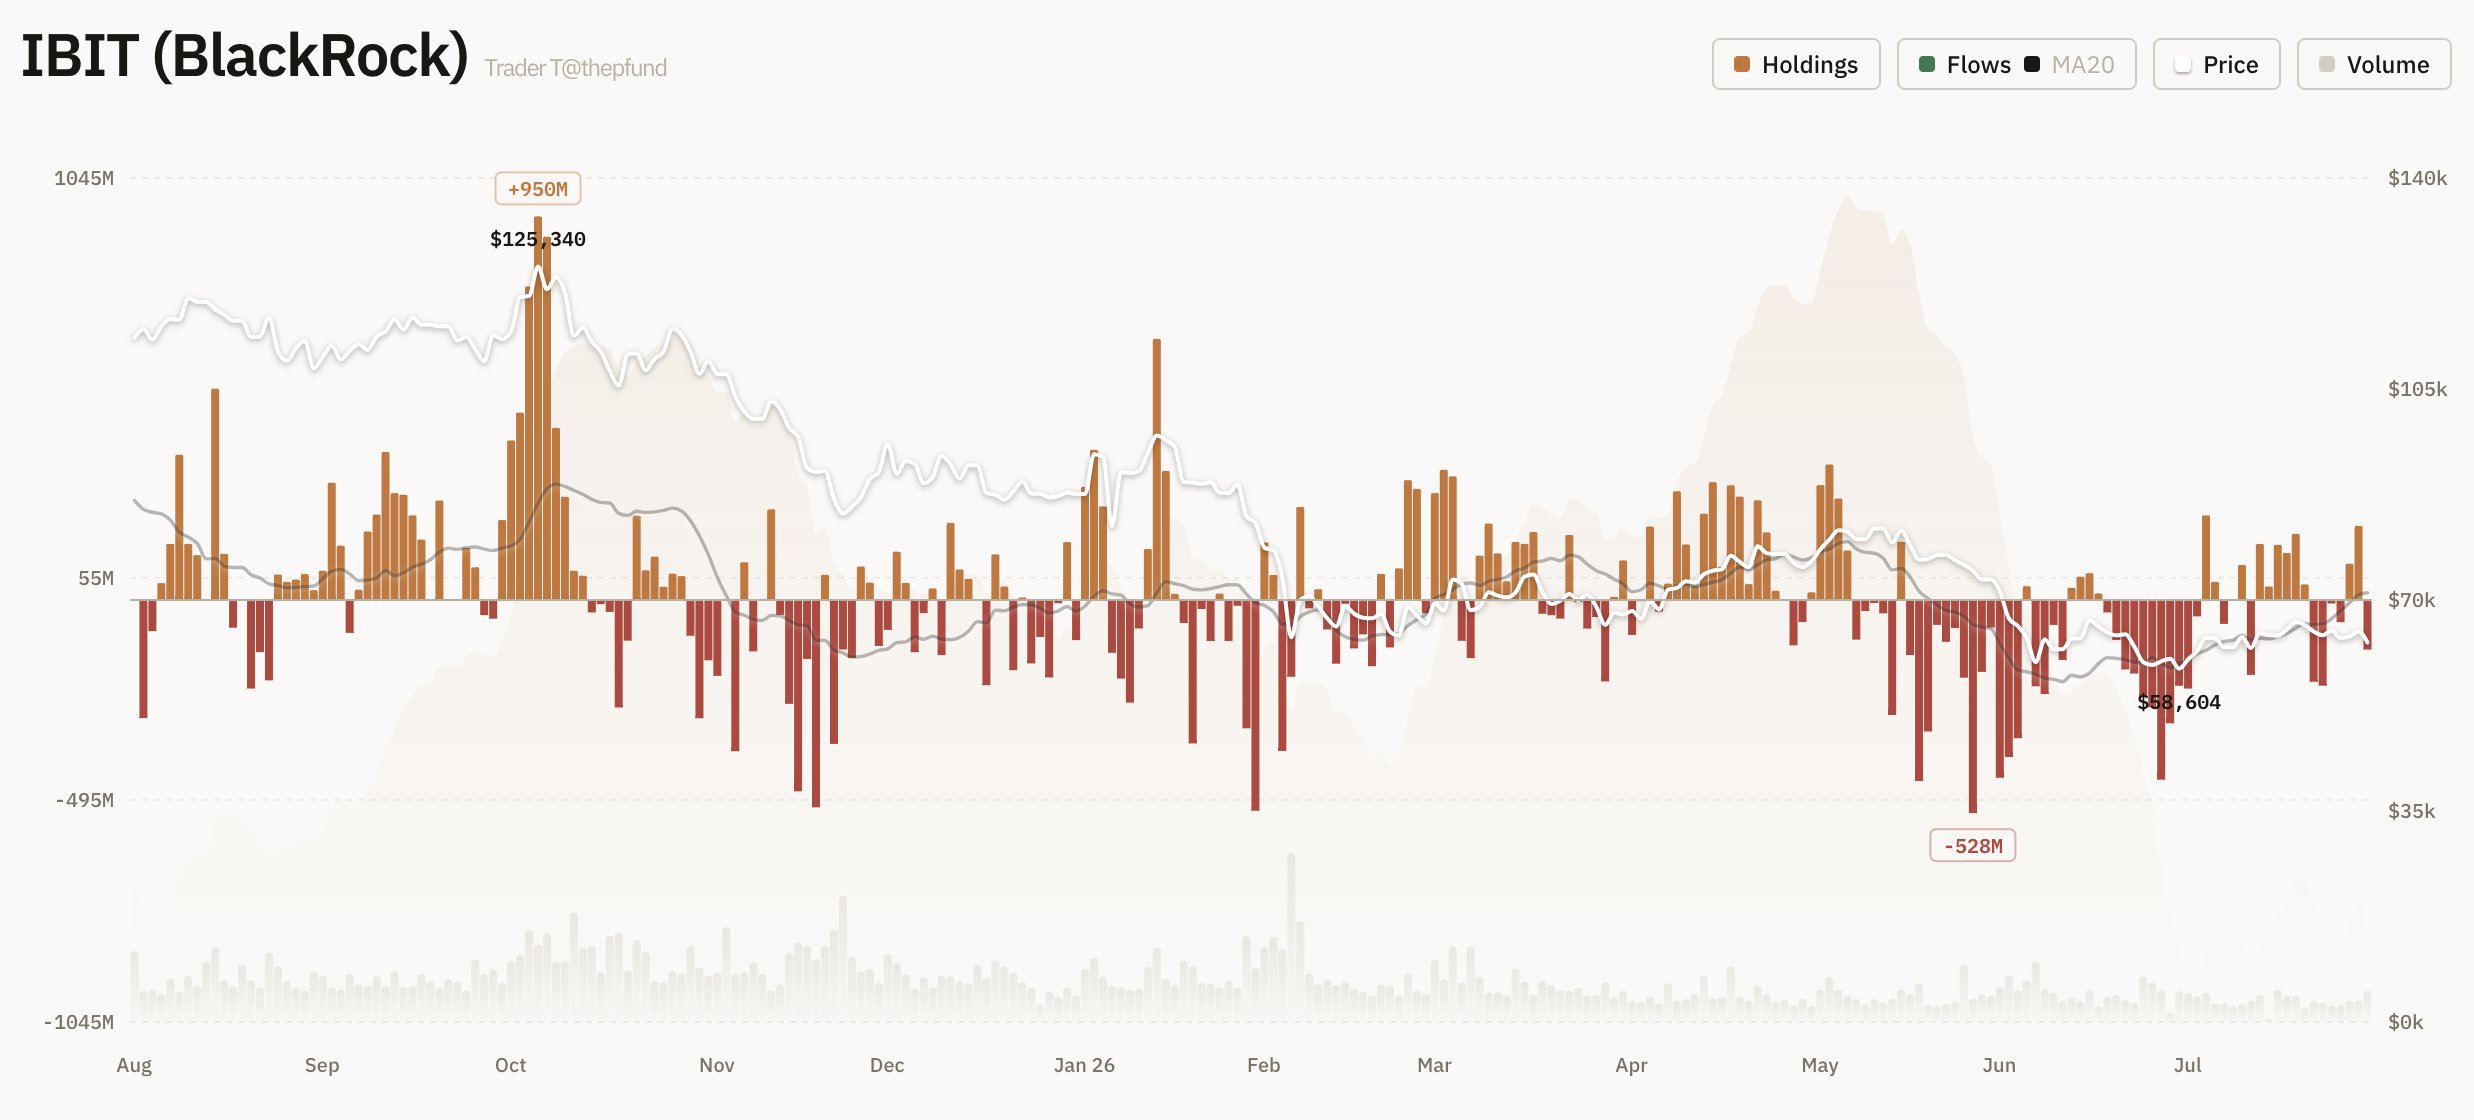
All other spot Bitcoin ETFs have reported zero net flows during the last trading session. At the same time, the BTC price is also seeing strong selling pressure, facing rejection at $65,000.
BTC Price Chart Shows Short Setup
Crypto analyst Ardi said that the Bitcoin price chart shows the formation of an “overshoot” pattern. This technical setup usually appears in an existing downtrend and can trap bullish traders before the broader upside resumes.
According to the analyst, the pattern develops after Bitcoin establishes a series of lower highs and lower lows. After this temporary rally, it creates a higher low and breaks above a local resistance level.
Ardi said this move can convince traders that a trend reversal is underway. It could attract new long positions while forcing short sellers to cover.
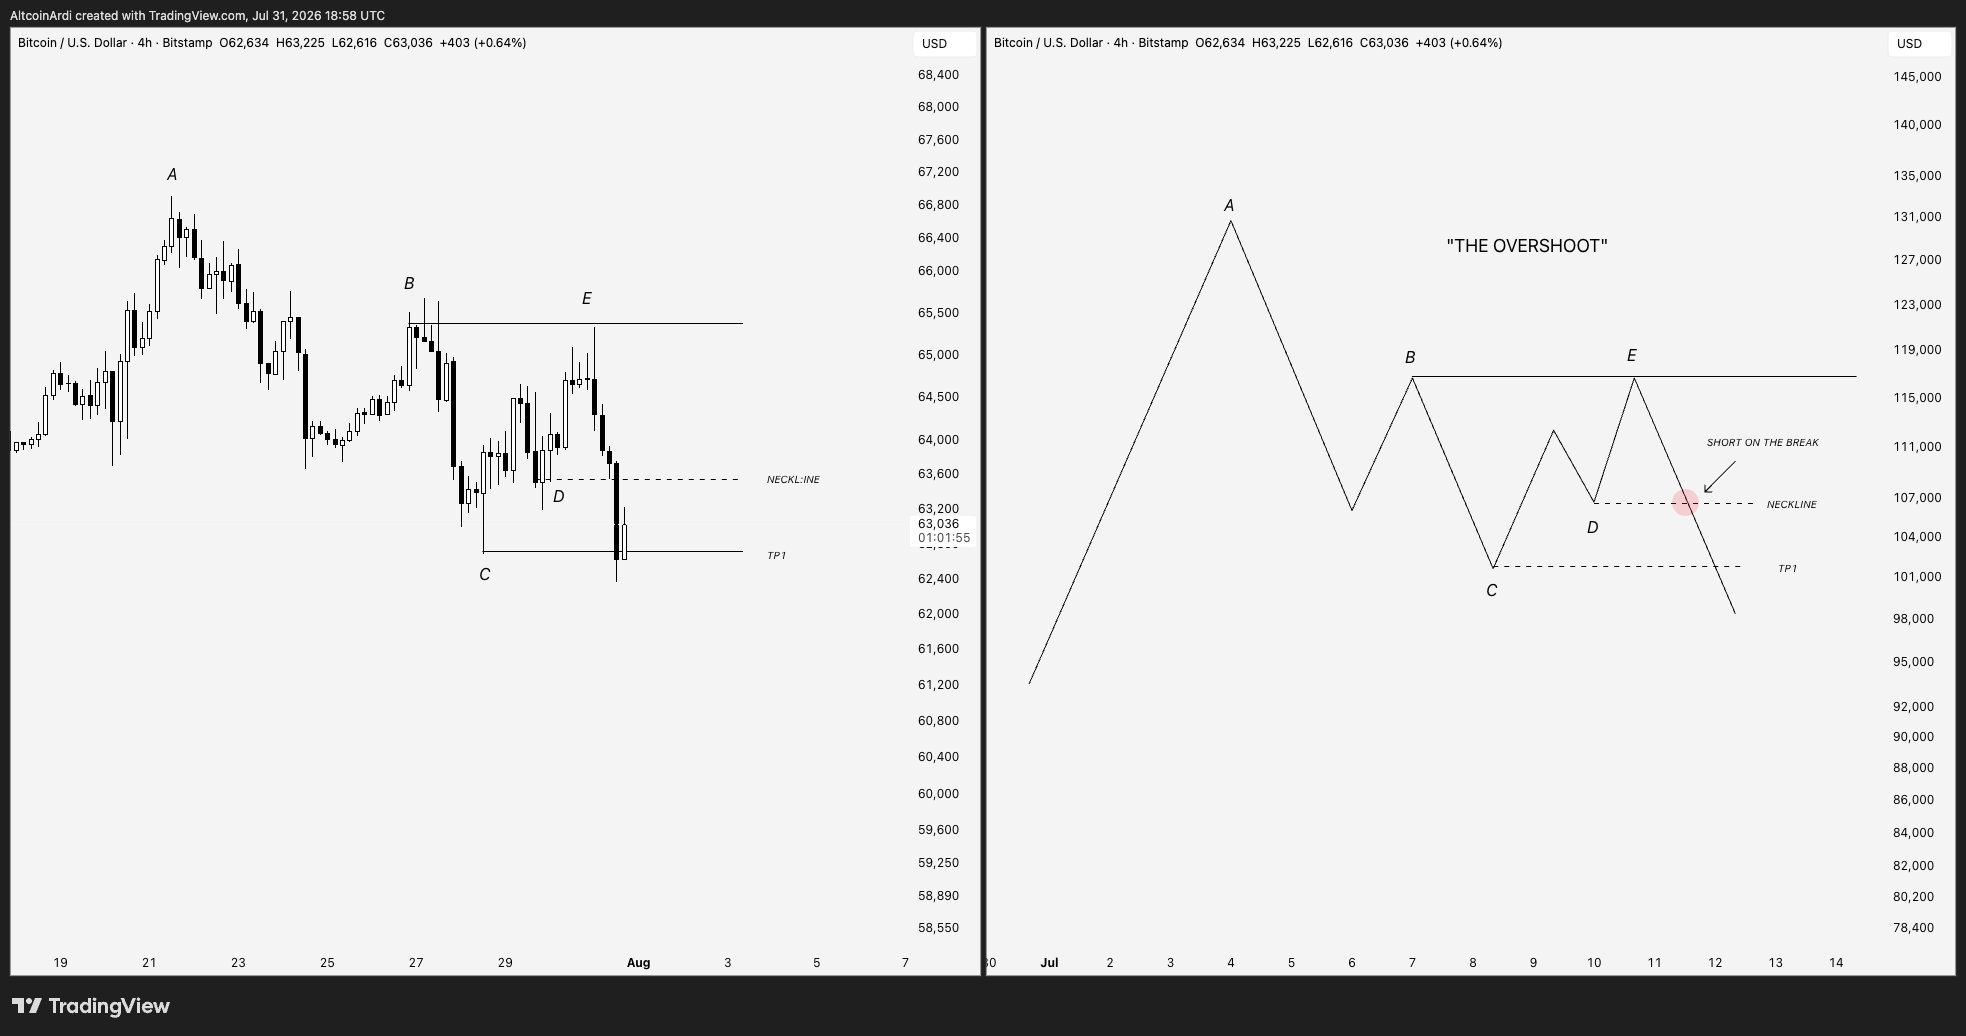
The analyst added that the bullish structure is invalidated once Bitcoin falls below the higher low that supported the breakout. He said BTC recently followed this pattern. Bitcoin rallied toward the previous lower high near $65,500, rejecting it at that level and losing support around $63,700.
Another analyst, Ali Martinez, noted that Bitcoin is showing a warning sign. He stated that the BTC price chart shows a sell signal just before August, a month historically related to BTC pullbacks.
Bitcoin Trading Volumes Drop to Lowest Since 2019
Blockchain analytics firm Glassnode noted that Bitcoin’s spot trading volume has dropped to its lowest levels since 2019. It reflects subdued activity across the market as institutional demand remains weak.
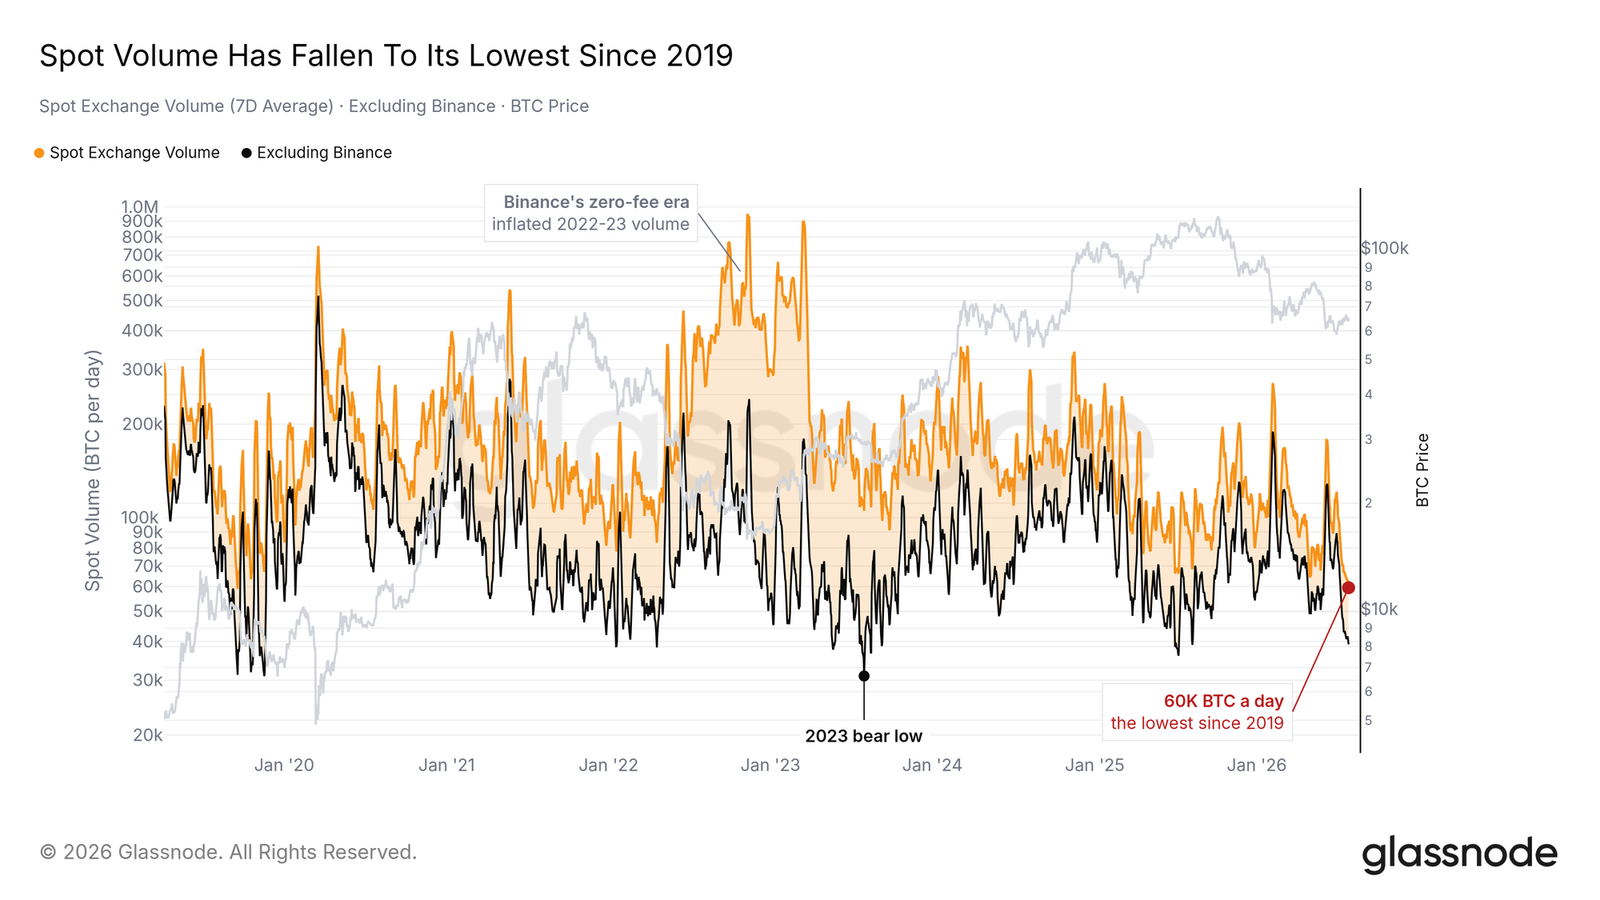
The analytics firm said Bitcoin’s three-month futures basis yield has remained below the U.S. two-year Treasury yield since February. As per Glassnode, this yield inversion shifts investor capital from Bitcoin to cash or government bonds.
Glassnode added that exchange flows and spot Bitcoin ETF demand remain muted. Moreover, the BTC price continues to trade within a major cost basis cluster between $62,000 and $68,000. With this, $69,000 is identified as a key resistance level.