Bunker Mode
 Pearl
Pearl Starknet
 NEAR Protocol
 Wormhole
 Quantus
 Pudgy Penguins

Bitcoin traded near $77,254 on Aug. 23 after reaching $79,461 during the latest daily session. The Bitcoin price prediction turned toward $90,000 as buyers challenged a major weekly resistance area. However, the same structure left downside liquidity concentrated below current levels.
The rebound mattered because Bitcoin had recovered sharply from its July low near $57,735. The move also pushed price above key retracement levels and revived institutional demand. Still, traders lacked confirmation above the broader descending resistance line. For BTC crypto traders, the weekly close now matters more than intraday spikes.
Bitcoin Price Prediction Faces Resistance Near $80,000
The TradingView Bitstamp chart showed Bitcoin closing around $77,254 after briefly touching $79,461. Price remained above the 0.786 Fibonacci level near $77,462. However, the session showed rejection immediately below the broader $80,000 resistance area.
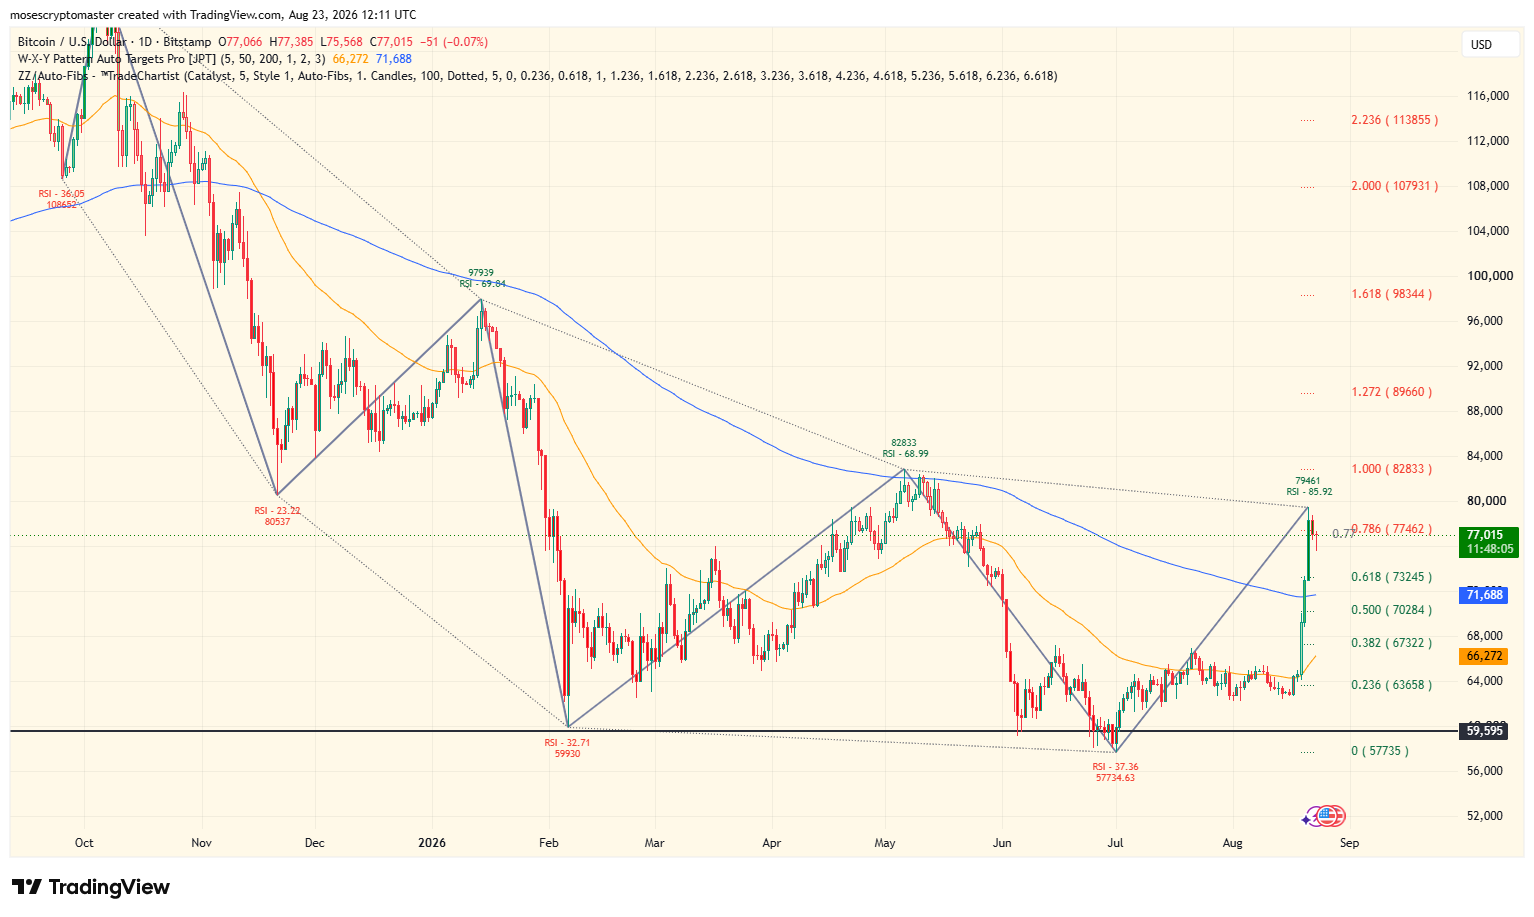
Bitstamp’s official BTC/USD market page showed active trading through Aug. 23. The exchange remained a primary venue for the chart supplied with this analysis. The price of bitcoin had already cleared the chart’s $73,245 Fibonacci support before testing resistance.
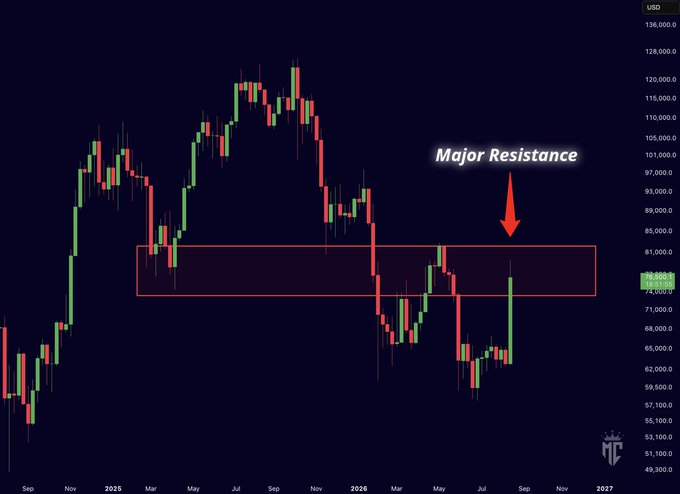
Mister Crypto said Bitcoin still faced a major weekly resistance zone. He argued the downtrend remained intact without a weekly close above it. A rejection, he said, could return price toward the prior range lows.
That setup kept $78,000 to $80,000 as the first upside test. A confirmed break would expose the chart’s next Fibonacci target near $82,833.
Bitcoin Price Prediction Gets Support From ETF Flows
Farside Investors data showed U.S. spot Bitcoin exchange-traded funds recorded $307.5 million of net inflows on Aug. 21. The funds had received $606.3 million one day earlier. Those flows followed $517.2 million on Aug. 19.
The three-day sequence showed renewed institutional demand during Bitcoin’s rebound. BlackRock’s IBIT accounted for $239.3 million of the Aug. 21 total, Farside data showed.
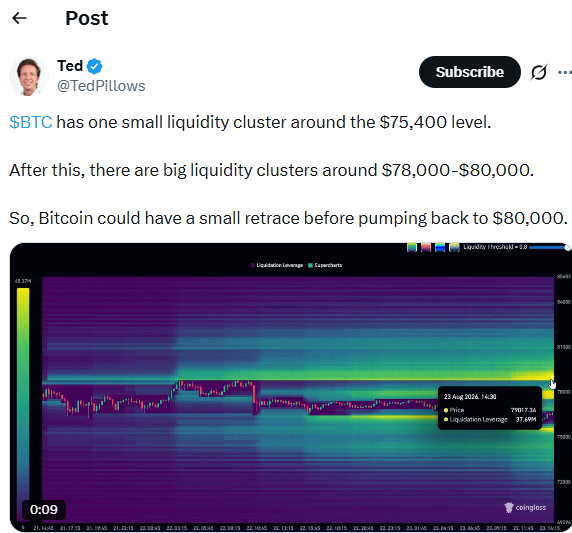
Ted Pillows also pointed to exchange-traded fund demand and large bids near $74,000 to $75,000. He said the daily moving average convergence divergence remained strong. His analysis placed $90,000 within reach if momentum continued.
Yet liquidity remained uneven. That Martini Guy identified larger clusters around $73,000 to $75,000 and $69,000 to $71,000. He said smaller liquidity remained above price near $78,000 to $80,000.
On-Chain Data Supports Bitcoin Momentum
CryptoQuant analyst Burak Kesmeci said Bitcoin’s Net Unrealized Profit/Loss rose from 0.16 to 0.32. He said the indicator crossed its 365-day simple moving average near 0.31. The crossover occurred for the first time since Oct. 10, 2025.
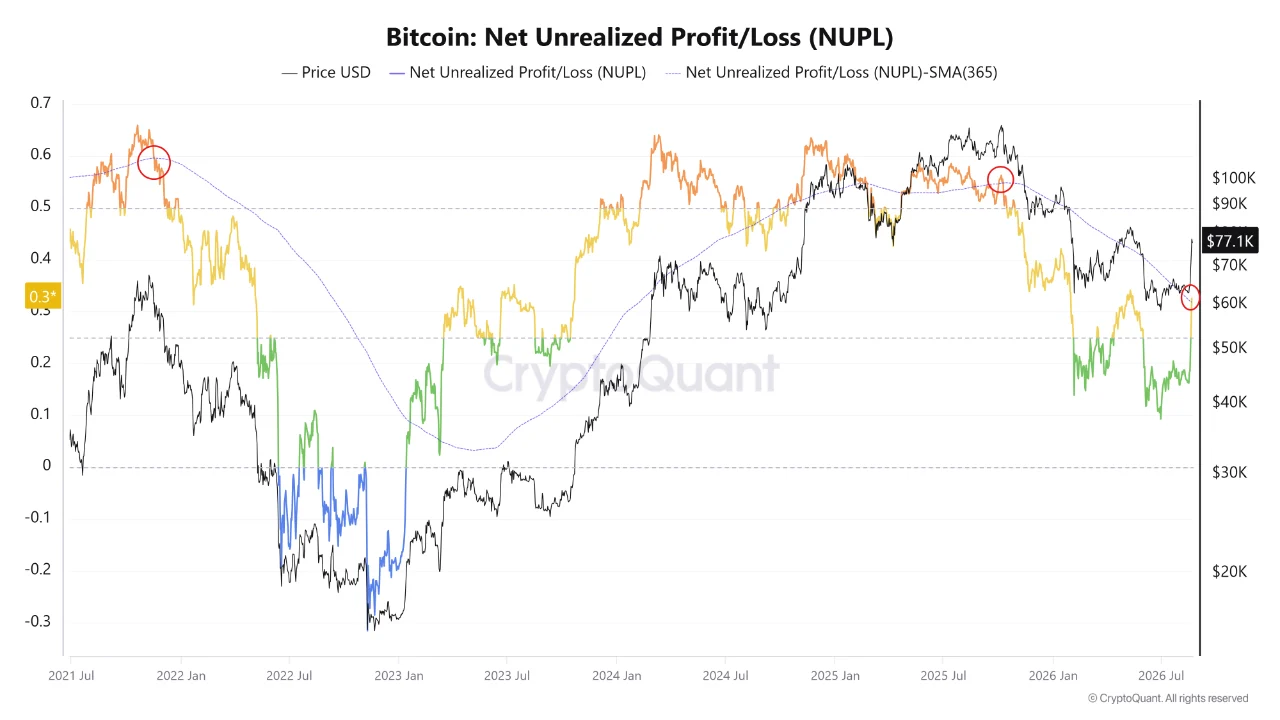
CryptoQuant defines Net Unrealized Profit/Loss as a gauge of aggregate unrealized investor profitability. Values above zero indicate broad unrealized profit across the market. Kesmeci said sustained positioning above the long-term average could support upward momentum.
The signal aligned with the sharp recovery from July lows. However, it did not remove nearby technical resistance. Bitcoin still had to hold above the weekly barrier before the broader structure improved.
Bitcoin Price Prediction Depends On $73,000 Support
Killa said Bitcoin’s latest impulse resembled earlier bottoming structures where pullbacks stayed shallow. He compared the setup with Bitcoin’s 2022 recovery. His analysis identified the $70,000 to $73,000 region as a potential local retracement zone.
Ted Pillows separately identified a smaller liquidity pocket around $75,400. He then pointed to larger liquidity between $78,000 and $80,000. That structure supported a short pullback before another resistance test.
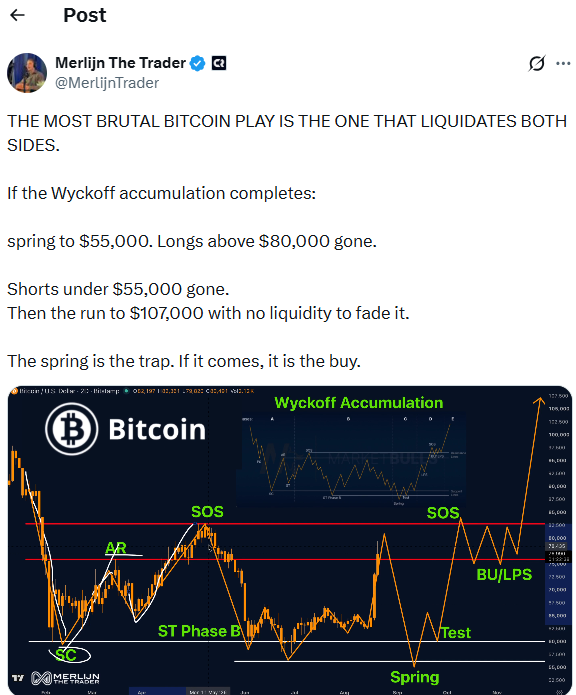
Merlijn The Trader outlined a deeper Wyckoff scenario. He said a spring toward $55,000 could remove leveraged longs before a larger recovery. His scenario then targeted $107,000, but depended on the accumulation structure completing.
CME Group’s Bitcoin futures calendar listed Aug. 28 as the settlement date for its August 2026 contract. That date added a derivatives catalyst after the weekly resistance test. CME also offers weekday Bitcoin options across its regulated derivatives market.
The chart showed immediate support near $73,245, followed by $70,284 and $67,322. Resistance remained concentrated near $79,461 and $82,833. A weekly close above the resistance band would strengthen the bullish case. Failure there would keep lower liquidity zones active.
The next test comes with the weekly close and CME’s Aug. 28 settlement. Holding $73,245 would preserve the rebound structure. A break below that level would shift attention toward $70,284 and lower liquidity.