
 streamoors
 Altai the Tiger
 Sword Inu
 IGNITION
 no crying in the casino
 Quantus
 Pearl
Pearl
MSTR stock traded near $129-$130 on Friday as investors reacted to stronger U.S. inflation and renewed pressure on Bitcoin. Strategy shares have pulled back sharply from their Sept. 3 intraday high of $144.92 as Treasury yields, energy prices and Federal Reserve tightening expectations increased. Bitcoin weakness adds another risk because Strategy remains the largest publicly traded corporate holder of BTC.
The latest Consumer Price Index report reinforced expectations that the Federal Reserve could raise rates at its Sept. 15-16 meeting. Headline inflation accelerated substantially on a monthly basis, while core prices also exceeded economists’ monthly forecast. That combination has made the macro environment less supportive for rate-sensitive assets such as Strategy and Bitcoin.
US Released Strong Consumer Inflation Report
MSTR stock may be at risk of a pullback after the US released a strong consumer inflation, which provided more color on the state of the economy. According to Bureau of Labor Statistics (BLS), the headline CPI rose from 0.1% in July to 0.4% in August. This monthly increase translated into a 3.4% annual growth, meaning that it remains above the 2% Federal Reserve target.
Most notably, the core CPI, which excludes the volatile food and energy prices, rose from 0.2% in July to 0.3% in August, higher than the expected 0.2%. It slipped from 2.5% to 2.4% on a MoM basis.
These numbers are important because they came a week after the US released a strong nonfarm payrolls (NFP) report. The economy created over 162k jobs last month, higher than what analysts predicted.
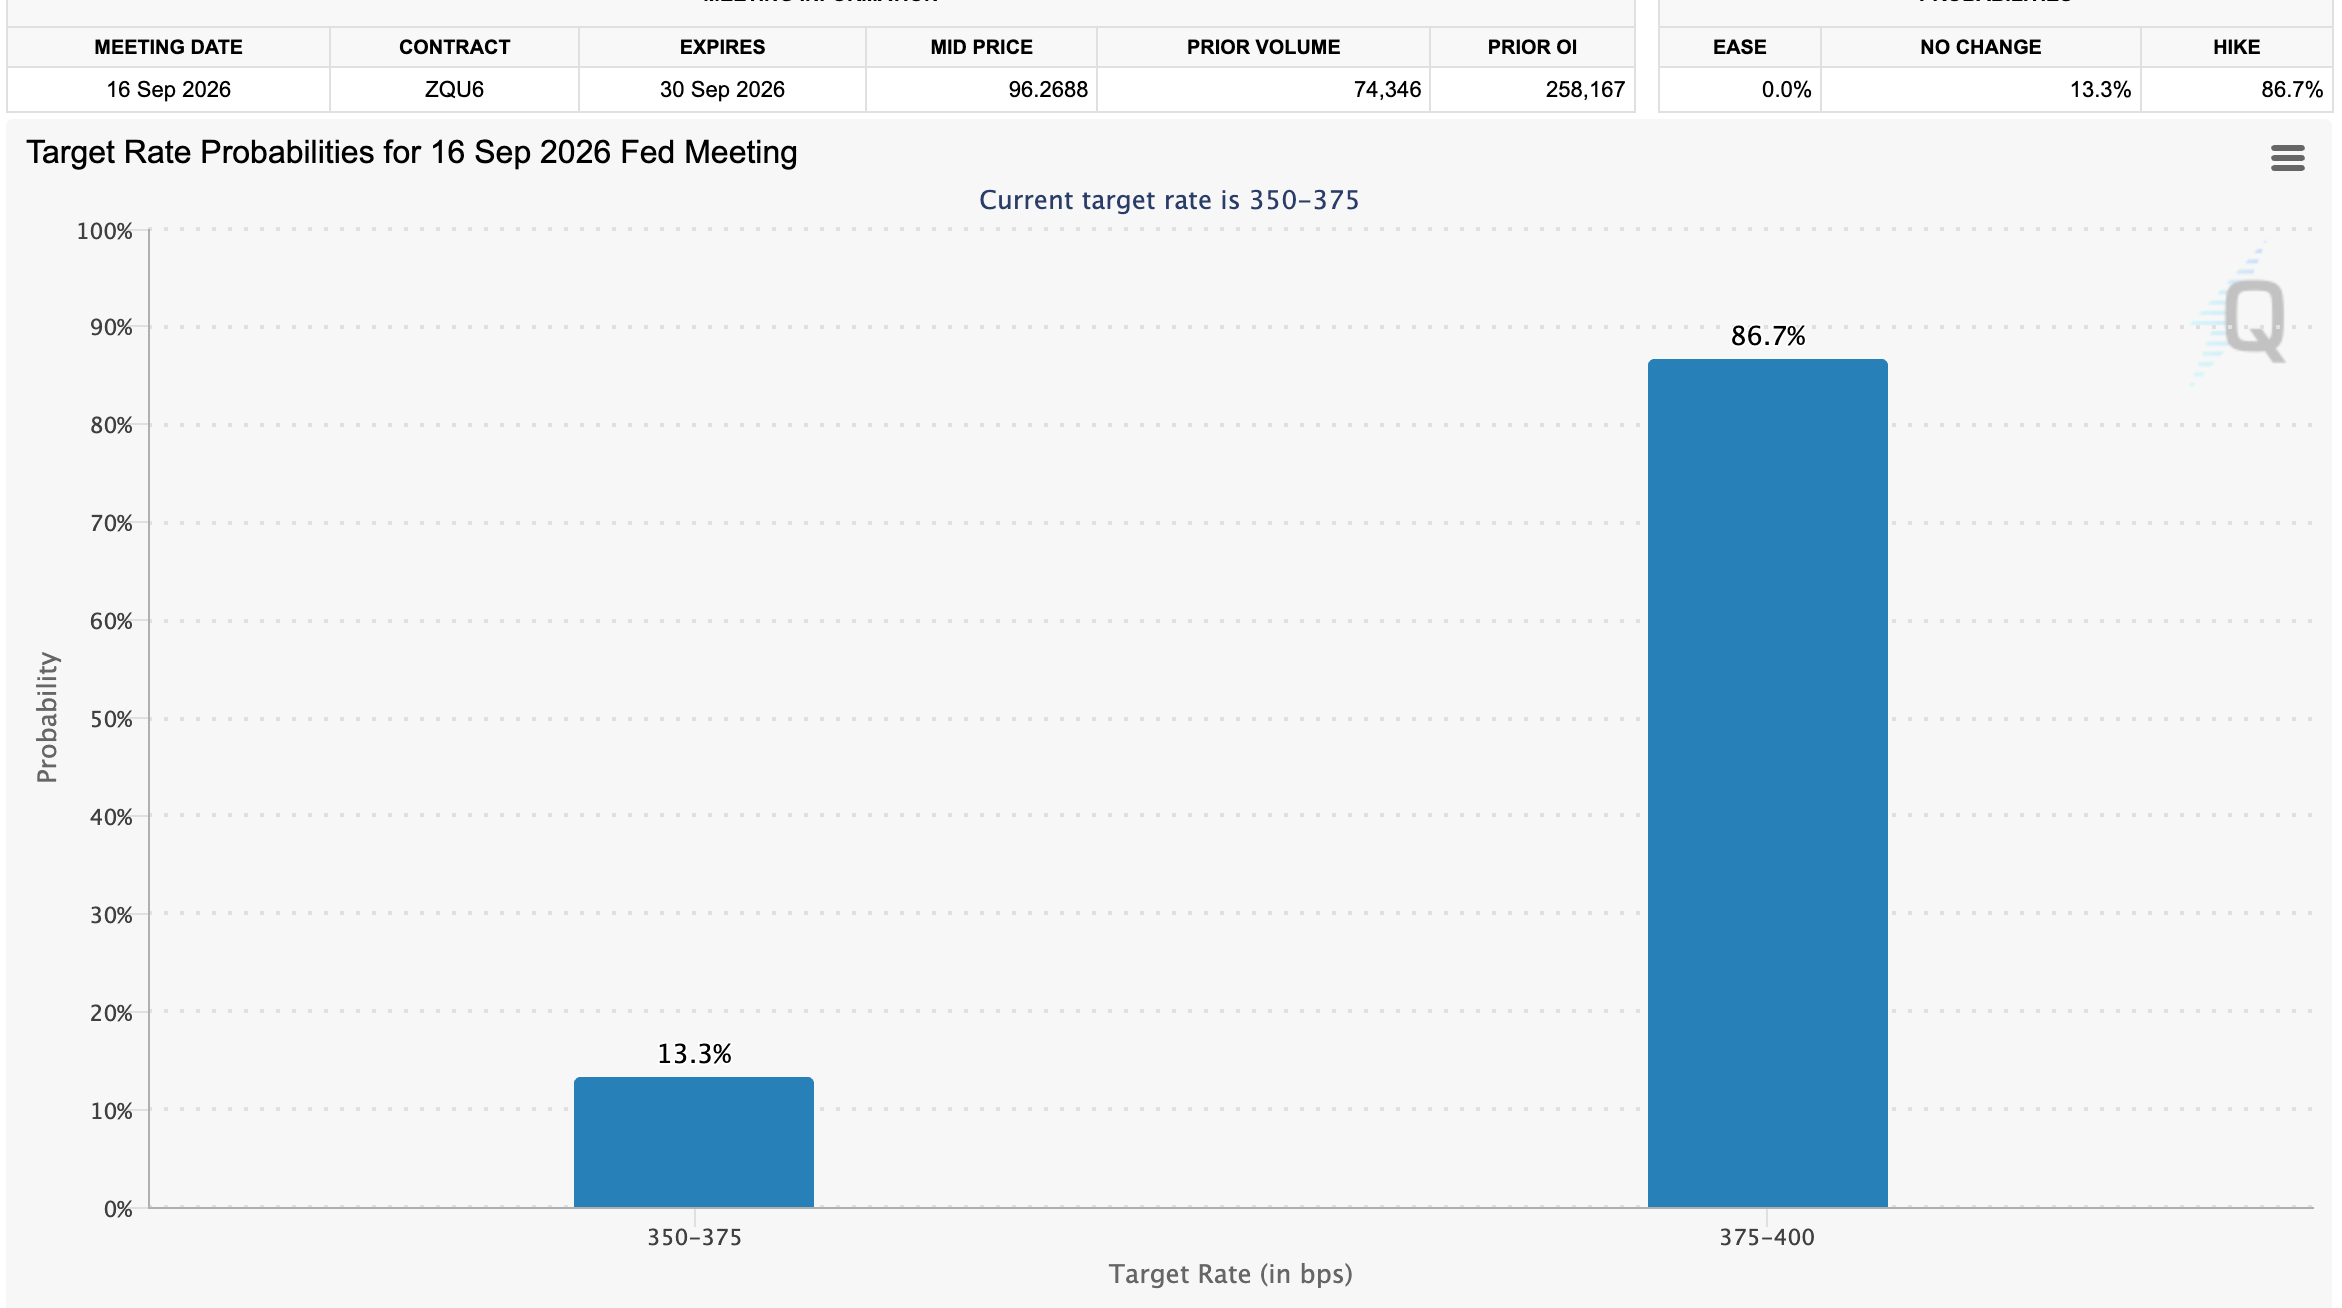
Therefore, the inflation report confirmed that the Federal Reserve will likely restart its interest rates next week. As the chart shows, the odds of a rate hike happening next week jumped to 86%.
US inflation will likely remain at an elevated level now that crude oil prices are soaring. The average diesel price jumped to $6 for the first time on record, while gasoline remained at $4.25. The prices will likely rise further as the crisis in the Middle East escalates. This also explains why US bond yields have continued surging.
Bitcoin Could Be at Risk After the Strong Inflation Report
The strong US inflation report provides another risk for Bitcoin price and MSTR stock because these assets tend to do well when the Fed is cutting interest rates.
These risks explain why investors have started to scale back their Bitcoin ETF holdings. Data shows that spot Bitcoin ETFs had $46 million in outflows on Tuesday, $120 million on Wednesday and $283 million on Thursday.
Therefore, if the Bitcoin price falls, Strategy will do the same since it is the biggest holder. It has 845,050 coins currently valued at over $66 billion. If Bitcoin drops from the current $78,500 to $70,000, its holdings would be worth $59 billion.
Strategy stock has other risks, including the fact that the management continues to dilute its shareholders through weekly capital raises. In its most recent statement, the company said that it repurchased $176 million of STRC and then increased the size of the Digital Credit Securities repurchase program from $1 billion to $2 billion. It is using the funds it raises from MSTR stock sales to do this.
MSTR Stock Price Technical Analysis
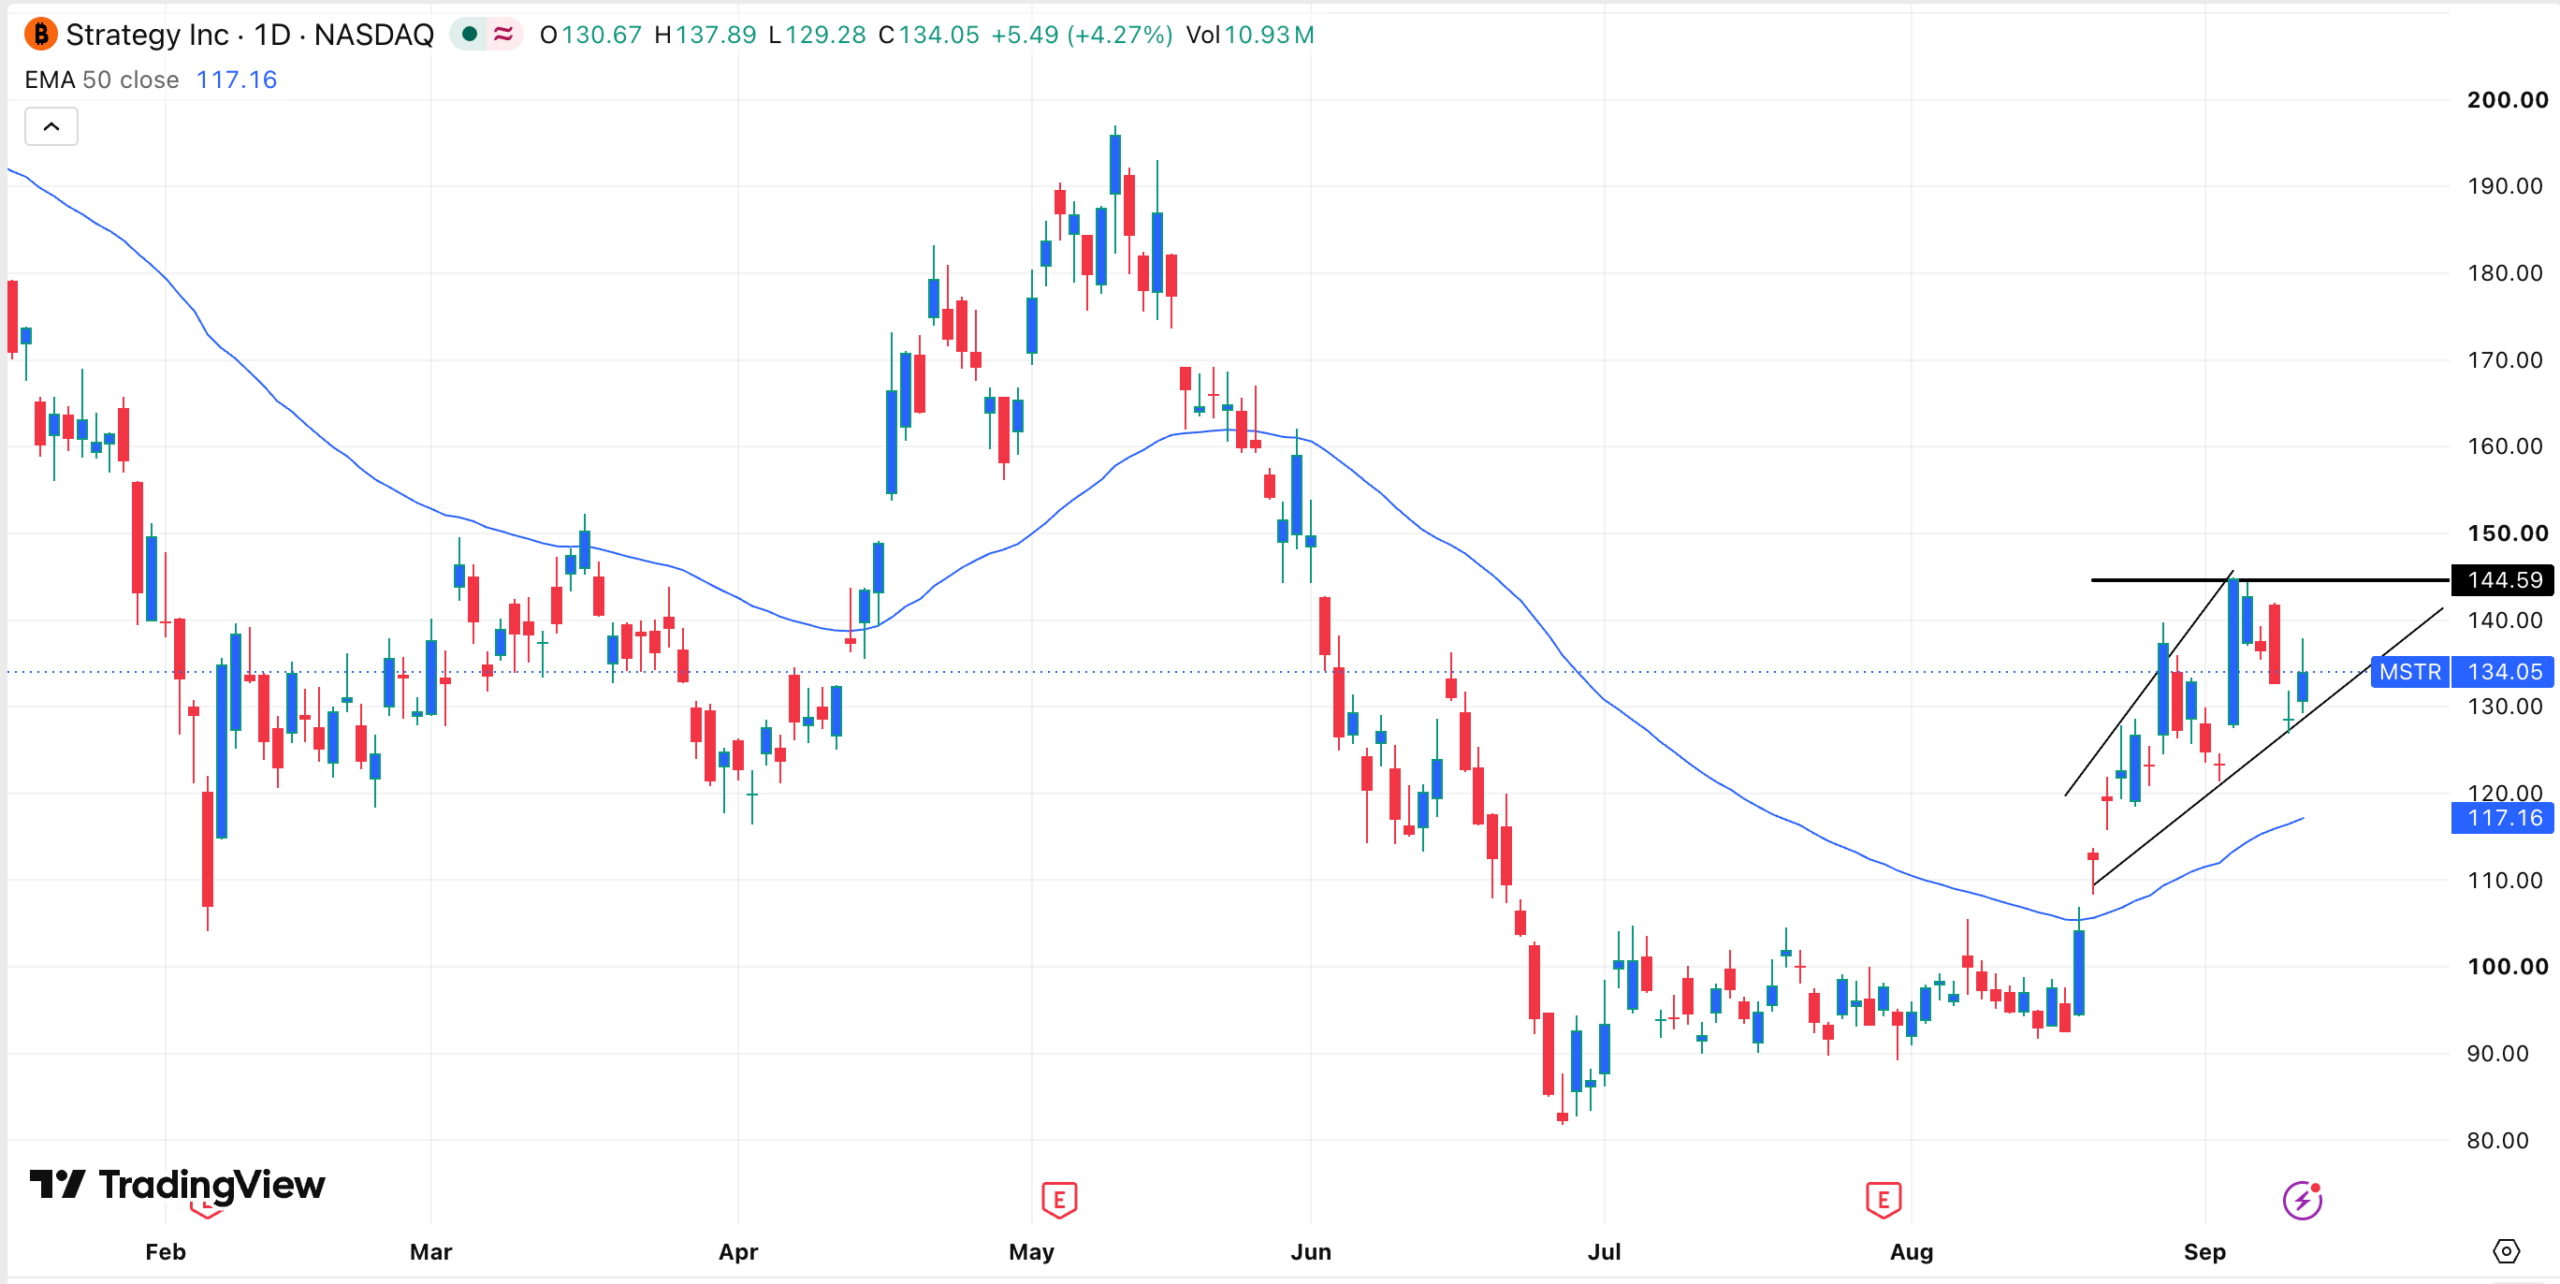
The daily chart shows that the Strategy stock peaked at $144.60 on September 3rd and then pulled back below $130 this week. On the positive side, it has formed an abandoned baby candlestick pattern, which is usually a bullish reversal sign. It has also remained above the ascending trendline connecting the lowest levels since August this year.
The stock also sits above the 50-day Exponential Moving Average (EMA). It has formed a megaphone pattern, which often leads to a bullish continuation. Therefore, the path of the least resistance is upwards as long as it remains above the ascending trendline. If this happens, the next key level to watch will be at $144.5.
This article is for informational purposes only and should not be considered financial or investment advice. Cryptocurrency and equity markets remain highly volatile. Readers should conduct independent research before making investment decisions.




