
 Bitcoin
 Pearl
 Pudgy Penguins
 Venice Token
 Hyperliquid
 WASTED
 Ethereum


Gold and Bitcoin prices remained under pressure on Nov. 19 as investors assessed rising interest-rate expectations. Bitcoin traded near $63,800, while gold hovered around $3,720 per ounce at 7 a.m. Eastern Time.
The declines followed a broader sell-off in risk assets and precious metals. Investors also assessed the Federal Reserve’s October meeting minutes, which pointed toward further monetary tightening.
U.S. spot Bitcoin exchange-traded funds (ETFs) continued recording withdrawals. Meanwhile, elevated Treasury yields and a stronger dollar added pressure to gold.
Gold and Bitcoin Prices Fall as Fed Rate-Hike Bets Rise
Gold and Bitcoin prices faced pressure as U.S. Treasury yields remained elevated. The benchmark 10-year yield hovered around 5%, increasing competition from interest-bearing government securities.
The 10-year Treasury yield had climbed amid concerns over persistent inflation and additional Federal Reserve tightening.
Investors also assessed the latest employment and inflation reports. Stronger economic data reinforced expectations that policymakers would maintain restrictive monetary conditions.
The Federal Reserve’s October meeting minutes added to those concerns. Policymakers expressed support for further interest-rate increases as inflation remained above the central bank’s 2% target.
According to the CME FedWatch tool, traders assigned approximately 90% probability to a 25-basis-point increase in December. Another 10% probability pointed toward a larger, 50-basis-point increase.
These expectations reflected market pricing rather than a confirmed Federal Reserve decision.
Higher interest rates generally increase the appeal of Treasury securities. Gold generates no interest income, making it sensitive to movements in real yields and the U.S. dollar.
Bitcoin also faced pressure from tighter financial conditions. However, cryptocurrency prices respond to additional factors, such as liquidity, institutional demand and derivatives positioning.
The dollar’s strength created another challenge for gold. A stronger U.S. currency makes dollar-denominated bullion more expensive for investors holding other currencies.
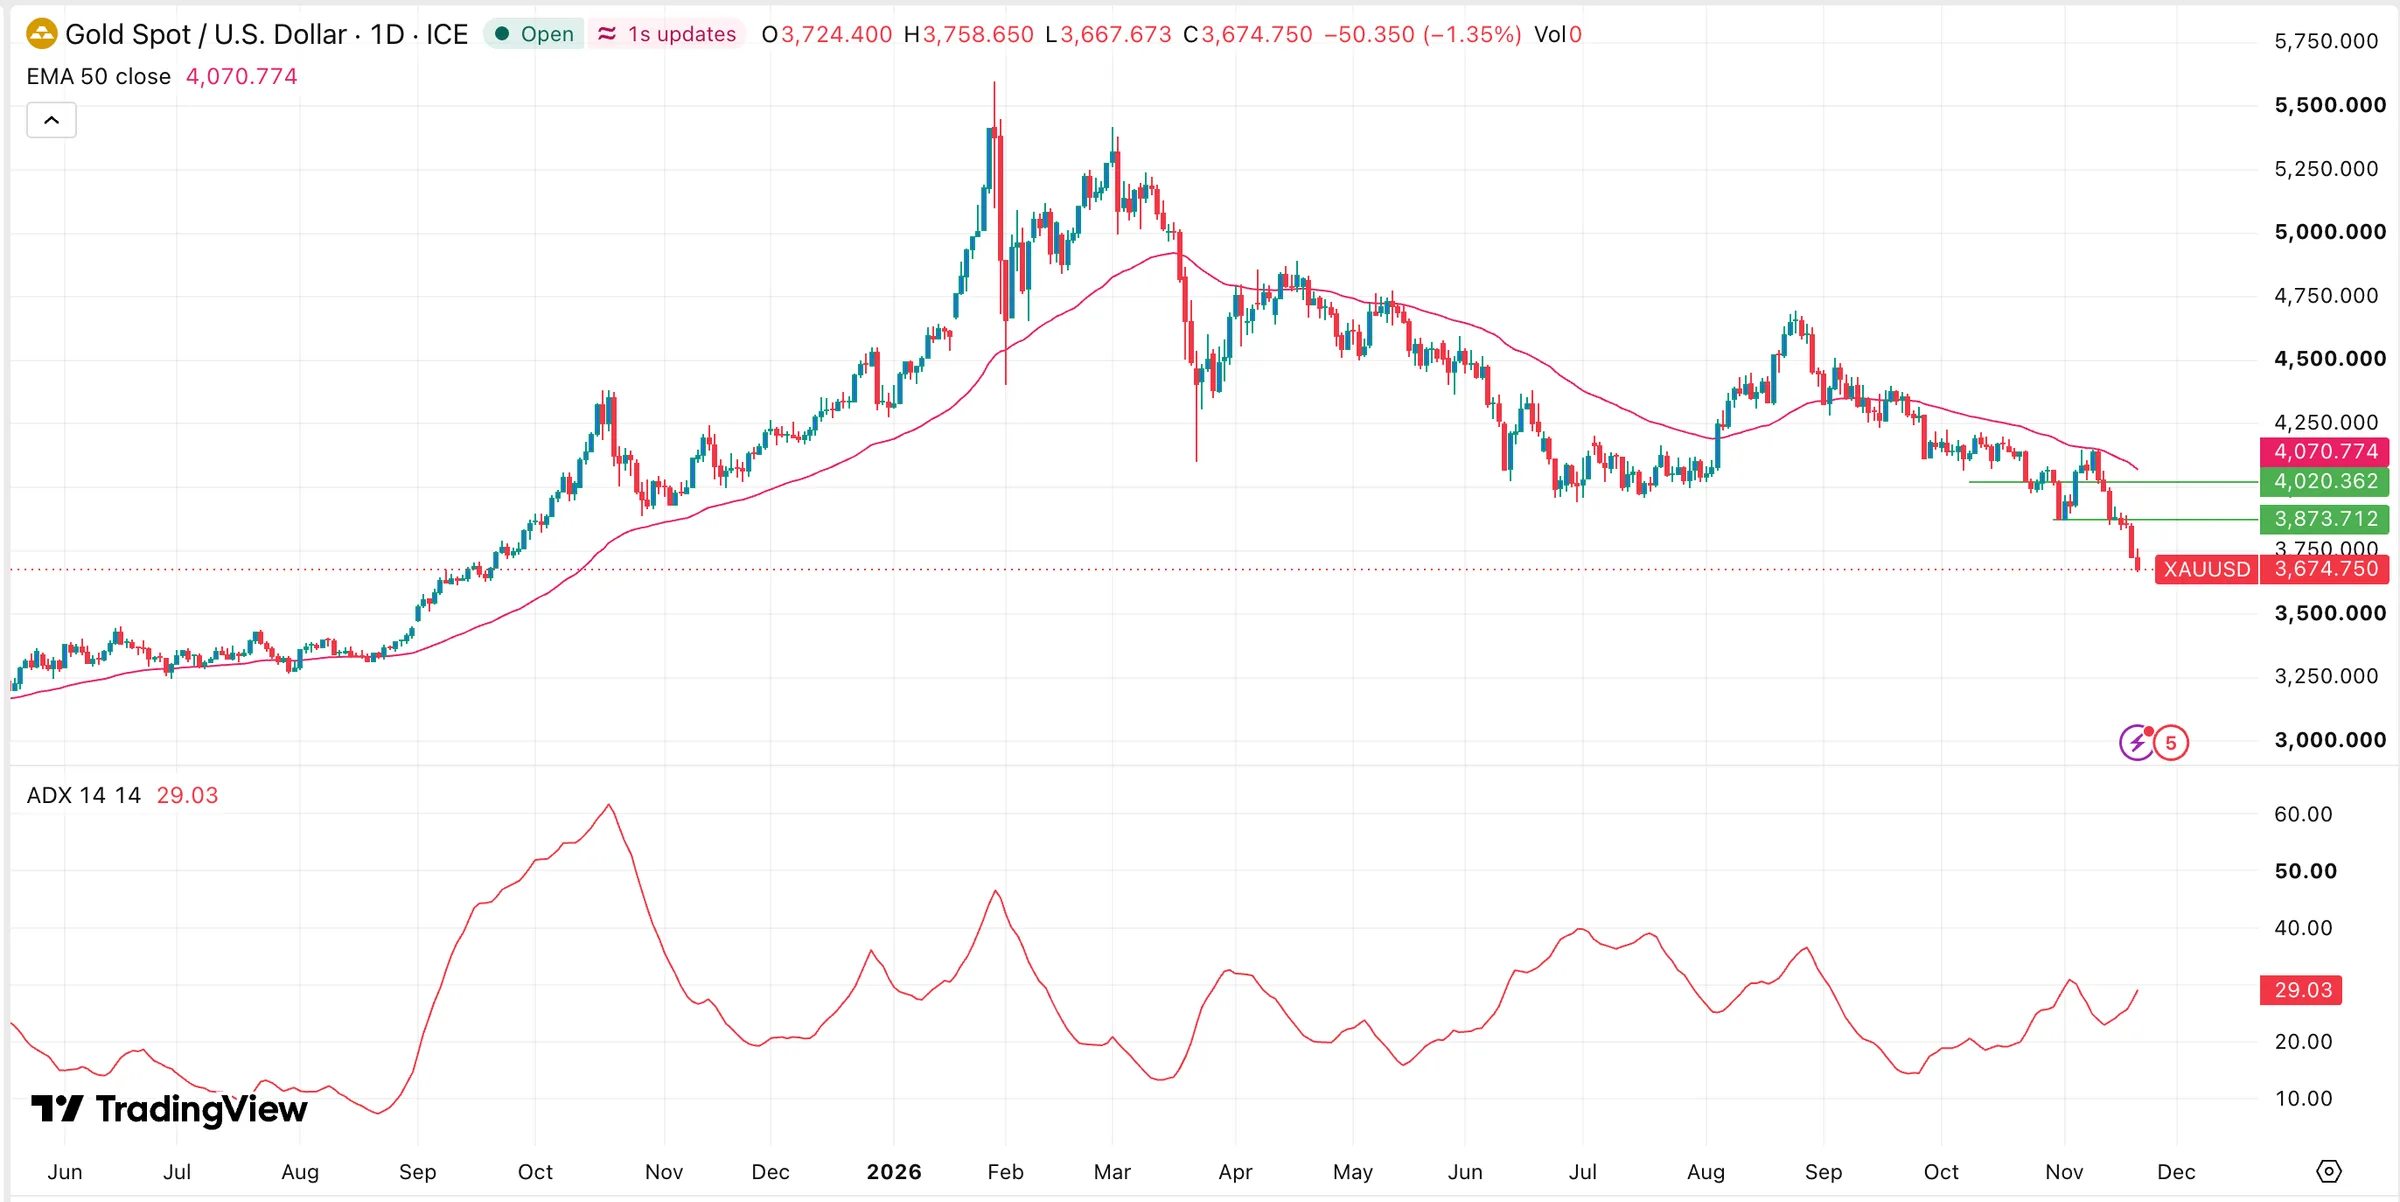
Reuters reported that spot gold subsequently fell to $3,674.13 per ounce on Nov. 19. Prices briefly touched $3,667.19, their lowest level in approximately 14 months.
Gold and Bitcoin ETF Outflows Have Jumped
Another reason behind the ongoing Bitcoin and gold drop is the ongoing ETF inflows and outflows. Data shows that investors have continued selling their assets in the past few months, a sign that most of them are fearful.
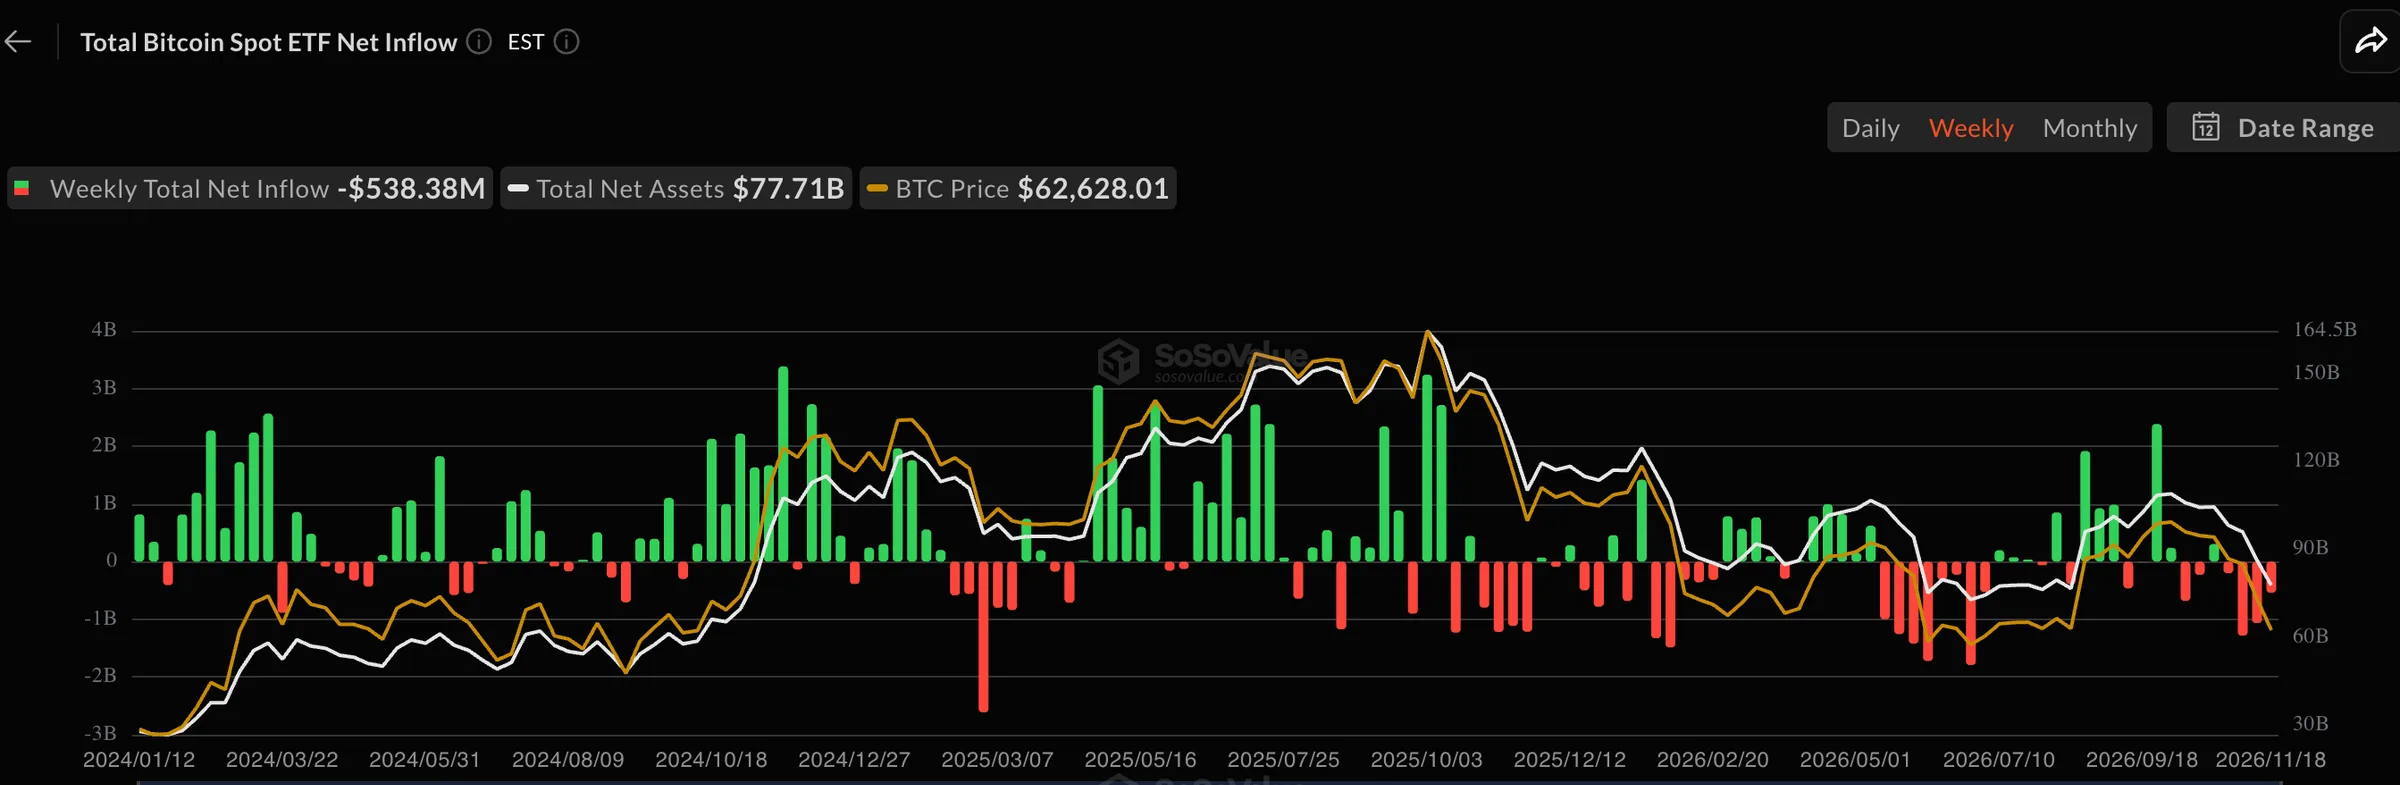
SoSoValue data shows that spot Bitcoin ETFs have shed over $2.89 billion in assets this month, the biggest monthly amount since June, when they lost $4.5 billion. Before that, the funds lost over $515 million last month. In most cases, ETF outflows is a sign that investors expect the coin’s price to drop over time.
The same trend is happening in the gold ETF market. For example, the SPDR Gold Shares ETF (GLD) has lost over $1.37 billion in the last 30 days. Similarly, the iShares Gold Trust (IAU) has lost over $279 million in assets in the same period.
Rising Fear in the Market
Gold and Bitcoin have also dropped because of the ongoing fear in the market. Data compiled by CNN Money shows that the Fear and Greed Index has fallen to the extreme fear zone of 25.
Similarly, the Crypto Fear and Greed Index has tumbled to the extreme fear zone of 12. In most cases, gold, Bitcoin, and stocks tend to underperform the market when there is a sense of fear in the market. This explains why the stock market is also falling.
Bitcoin Price Technicals Have Also Contributed
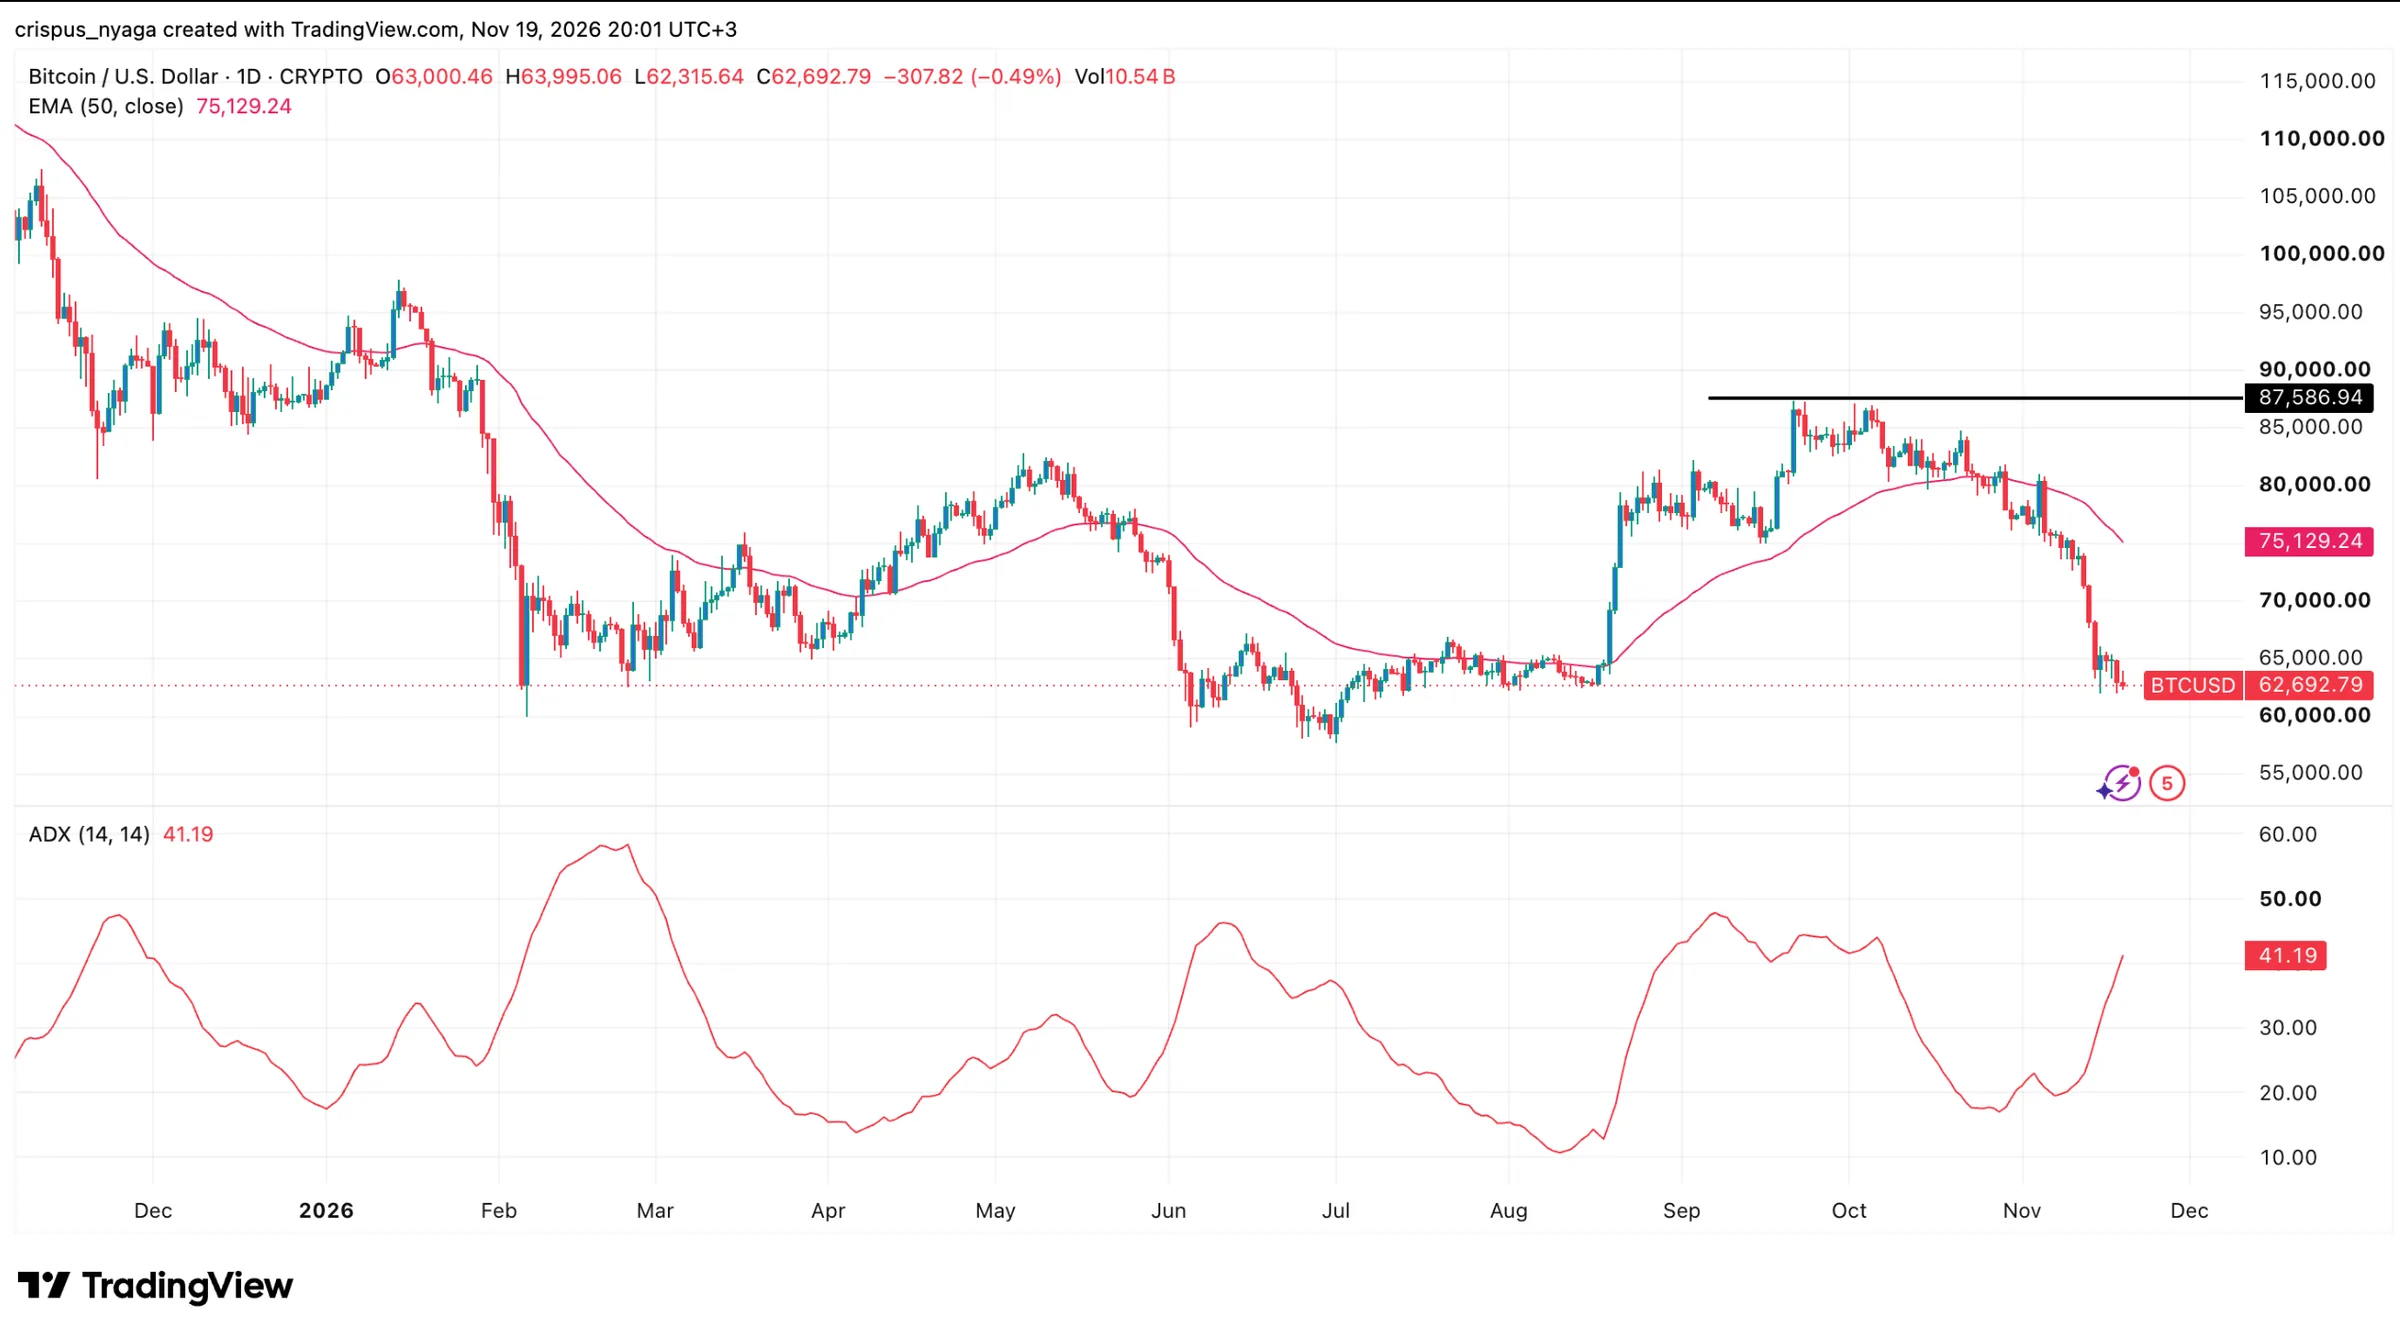
The daily chart shows that the BTC price has slumped in the past few months. It has slumped from a high of $87,586 in September to the current $62,750. The coin has slumped below the 50-day Exponential Moving Average (EMA). Also, the Average Directional Index (ADX) has jumped to 41.20, its highest level since October 8, a sign that the downward trend is continuing. These technicals also explain why the coin is falling.
Bitcoin and Gold Price Technicals Point to Further Risks
Technical indicators suggested that Gold and Bitcoin prices remained vulnerable after their recent declines.
Bitcoin had fallen sharply from its September high of approximately $87,586. The original daily chart placed the cryptocurrency near $62,750 during the latest downturn.
The price also traded below its 50-day exponential moving average (EMA), suggesting that short-term momentum remained weak.
The chart showed an Average Directional Index (ADX) reading of 41.20. Readings above 25 generally indicate an established trend, although the indicator does not independently determine direction.
Bitcoin’s position below its moving average provided additional evidence of bearish price momentum.
The $62,000 area remained an important level after Bitcoin approached that region during the latest sell-off.
A sustained decline below that area could expose the cryptocurrency to additional selling. Conversely, a recovery above $64,000 could indicate improving short-term demand.
Gold also faced technical pressure after losing the $4,000 psychological level.
The original chart identified $3,873 as another important support area. Prices subsequently fell below that level as sellers maintained control.
However, a support breakdown alone does not establish the invalidation of a double-bottom pattern. That assessment depends on the pattern’s formation and neckline.
Gold’s decline toward $3,667 on Nov. 19 demonstrated that selling pressure had continued beyond those earlier levels.
The next developments will depend partly on Treasury yields, Federal Reserve expectations and institutional investment flows.
Further increases in yields could maintain pressure on non-yielding assets. Lower yields and renewed ETF inflows could provide some relief, although neither outcome guarantees a price recovery.
This article provides market information and analysis, not investment advice. Cryptocurrency and commodity prices remain volatile, and historical performance does not guarantee future returns.