Dacity Coin
 NEAR Protocol
 Quantus
 Bitcoin
 Celestia
 Pearl
Pearl Pudgy Penguins

Key Insights:
- BTC sees -26.62% drawdown, matching August 2024 cycle low
- Over 25% of total BTC supply—5.1M coins—now underwater
- Supertrend indicator shows price testing key support near $79.6K
A sharp correction is taking place in Bitcoin. According to CryptoQuant, Bitcoin currently shows a -26.62% drawdown from its yearly high as of April 2025. This matches the drawdown recorded in Aug. 2024. The chart of yearly drawdowns shows this recent drop as the most severe of the current market cycle.
After hitting new highs in early 2025, the price has been pulling back steadily. Price corrections are normal in bull markets, but this decline is more pronounced than the previous ones. Each correction from March 2023 to early 2024 was shorter in duration and milder in scale.
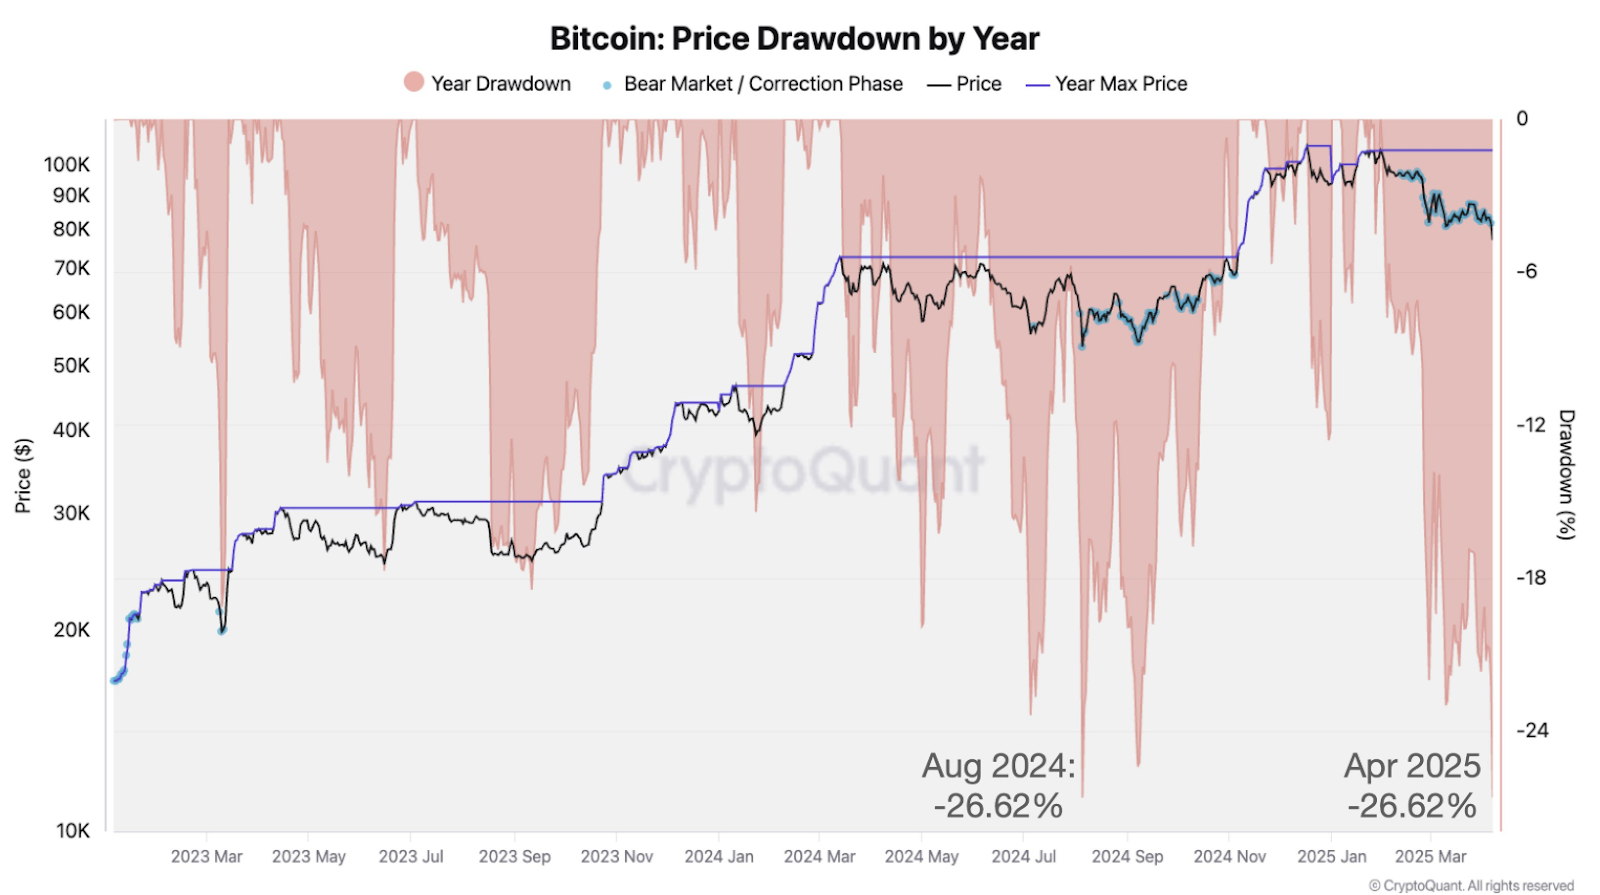
Although the recent pullback has occurred, the blue line that is the yearly maximum price has not come down. But the black price line has been steadily declining, and Bitcoin is now trading significantly below its most recent peak of around $100,000.
Over 25% of Bitcoin Supply Is Now in Loss
Moreover, CryptoQuant also has another chart that shows the percentage of Bitcoin supply that is currently in loss. By early April 2025, 25.8% of the circulating Bitcoin supply (5,124,348 BTC) is now underwater. This implies that these coins were bought at prices more than the current market value.
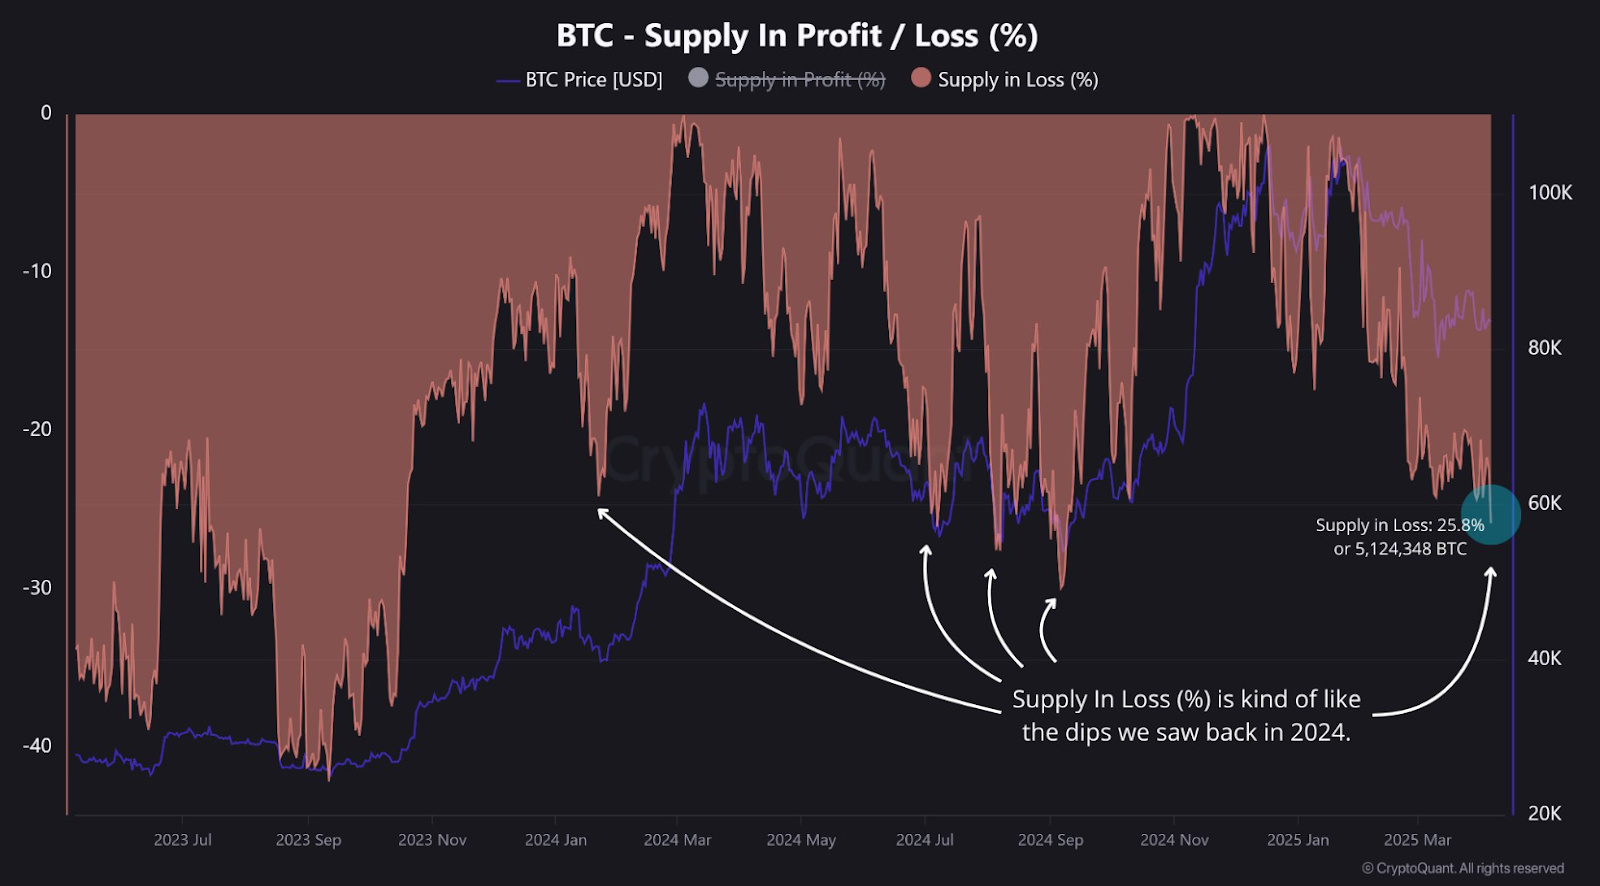
This level of loss is similar to previous points in 2024. On Aug. 5, 2024, the percentage in loss peaked at 27.5%, and on Sept. 6, it climbed to 29.9%. Although price recovered after these dips, the recovery period varied. The loss percentage in Jan. 2024 was 24.1%.
Supply in loss and broader market corrections often reflect investor sentiment. When many holders are underwater, panic selling can follow, adding pressure to the market. However, these phases also historically align with bottom formation during bull cycles.
Price Testing Key Support According to Technical Indicators
Meanwhile, Bitcoin is bouncing from a key support level on a weekly chart with the Supertrend indicator. The price has hit the lower boundary of the bullish trend band, and this level has been supporting in the past. Similar bounces have resulted in new uptrends in previous cycles, including the 2023 recovery.
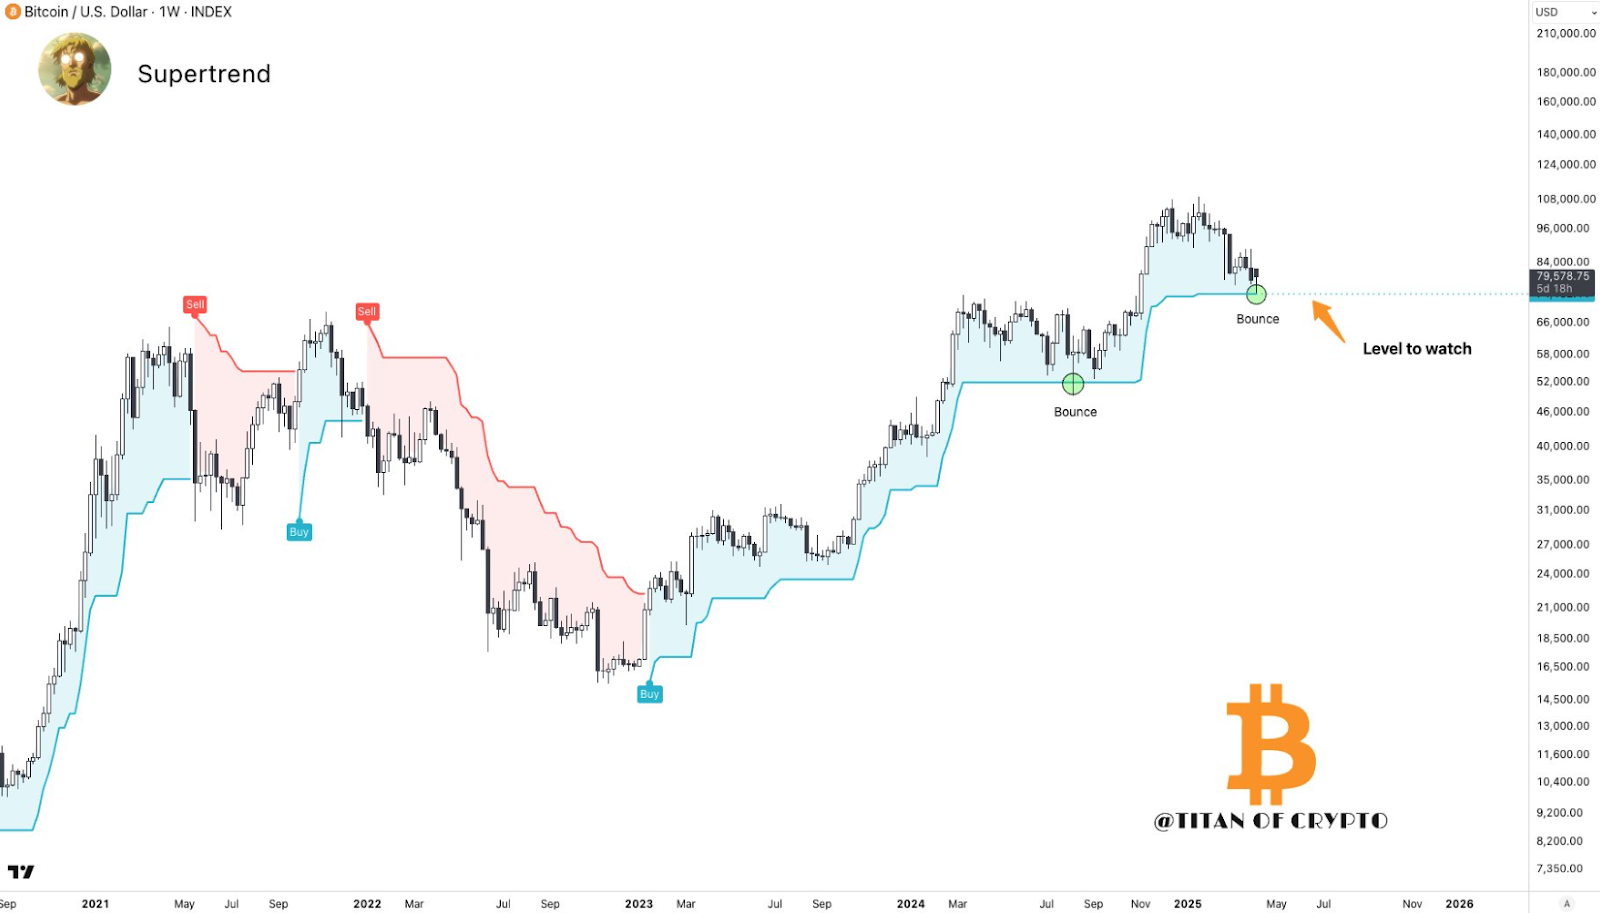
Bitcoin is currently trading close to $79,578, above the support band. The Supertrend tool, which is widely used in the market to track trend direction and potential reversals, indicates that this area is important. If it breaks below it, more losses may follow, while holding it may result in a continuation of the bullish trend.
As the chart shows, Bitcoin has respected this indicator several times in the past. For instance, during the 2023 uptrend, the price rebounded from the same indicator line and proceeded higher. This level is now being watched closely by traders.
Historical Corrections Show a Pattern in Bitcoin Trend
Each correction is short-term and uncertain, but often it is part of a broader uptrend. The data shows that the market is following a similar pattern when comparing past retracements with the current one. As the price climbs higher, corrections have been deeper, which is in line with past cycles.
Technically, Bitcoin is now testing important levels. The current correction in loss percentage of supply is the same size as we saw during key moments in 2024. The patterns suggest that the market may be undergoing a healthy, albeit painful, pullback phase that has been seen before.
With historical drawdowns and supply in loss nearing cycle highs, traders and investors are watching to see if Bitcoin can hold above its current support. And this will depend on broader market confidence and whether investor demand continues.
Disclaimer
This article is for informational purposes only and provides no financial, investment, or other advice. The author or any people mentioned in this article are not responsible for any financial loss that may occur from investing in or trading. Please do your research before making any financial decisions.